Column Chart
In This Topic
Vertical tetragons are used to display information in Column Charts. There are three types:
Normal
- Normal Column charts create tetragons based on the data. They use DateTimeXAxis or IndexedXAxis as the XAxis based on the series and NumericYAxis as the YAxis.
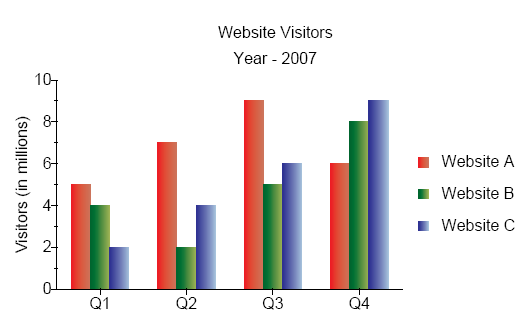
- Figure 1 - Normal Column Chart
-
[Java] // Create a PDF Document Document document = new Document(); // Create a Page and add it to the document Page page = new Page(); document.getPages().add(page); // Create a chart Chart chart = new Chart(0, 0, 400, 230); // Create a plot area PlotArea plotArea = chart.getPrimaryPlotArea(); // Create header titles and add it to the chart Title title1 = new Title("Website Visitors"); Title title2 = new Title("Year - 2007"); chart.getHeaderTitles().add(title1); chart.getHeaderTitles().add(title2); -
AutoGradient myAutogradient1 = new AutoGradient(90.0f, CmykColor.getRed(), CmykColor.getIndianRed())
AutoGradient myAutogradient2 = new AutoGradient(90.0f, CmykColor.getGreen(), CmykColor.getYellowGreen())
AutoGradient myAutogradient3 = new AutoGradient(120.0f, CmykColor.getBlue(), CmykColor.getLightBlue()) // Create a indexed column series and add values to it IndexedColumnSeries columnSeries1 = new IndexedColumnSeries("Website A", myAutogradient1); columnSeries1.getValues().add(new float[] { 5, 7, 9, 6 }); IndexedColumnSeries columnSeries2 = new IndexedColumnSeries("Website B", myAutogradient2); columnSeries2.getValues().add(new float[] { 4, 2, 5, 8 }); IndexedColumnSeries columnSeries3 = new IndexedColumnSeries("Website C", myAutogradient3); columnSeries3.getValues().add(new float[] { 2, 4, 6, 9 }); // Add indexed column series to the plot area plotArea.getSeries().add(columnSeries1); plotArea.getSeries().add(columnSeries2); plotArea.getSeries().add(columnSeries3); // Create a title and add it to the yaxis Title lTitle = new Title("Visitors (in millions)"); columnSeries1.getYAxis().getTitles().add(lTitle); //Adding AxisLabels to the XAxis columnSeries1.getXAxis().getLabels().add(new IndexedXAxisLabel("Q1", 0)); columnSeries1.getXAxis().getLabels().add(new IndexedXAxisLabel("Q2", 1)); columnSeries1.getXAxis().getLabels().add(new IndexedXAxisLabel("Q3", 2)); columnSeries1.getXAxis().getLabels().add(new IndexedXAxisLabel("Q4", 3)); // Add the chart to the page page.getElements().add(chart); // Save the PDF document.draw("[PhysicalPath]/MyDocument.pdf"); - Stacked
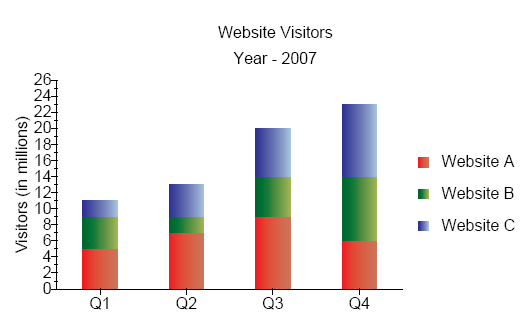
- Stacked charts show related data, one on top of the other. They use DateTimeXAxis or IndexedXAxis as the XAxis based on the series and NumericYAxis as the YAxis.
-
Figure 2 - Stacked Column Chart
[Java] // Create a PDF Document Document document = new Document(); // Create a Page and add it to the document Page page = new Page(); document.getPages().add(page); // Create a chart Chart chart = new Chart(0, 0, 400, 230); // Create a plot area PlotArea plotArea = chart.getPrimaryPlotArea(); Create header titles and add it to the chart Title title1 = new Title("Website Visitors"); Title title2 = new Title("Year - 2007"); chart.getHeaderTitles().add(title1); chart.getHeaderTitles().add(title2); -
AutoGradient myAutogradient1 = new AutoGradient(180.0f, CmykColor.getRed(), CmykColor.getIndianRed())
AutoGradient myAutogradient2 = new AutoGradient(180.0f, CmykColor.getGreen(), CmykColor.getYellowGreen())
AutoGradient myAutogradient3 = new AutoGradient(180.0f, CmykColor.getBlue(), CmykColor.getLightBlue()) // Create a indexed stacked column series elements and add values to it IndexedStackedColumnSeriesElement seriesElement1 = new IndexedStackedColumnSeriesElement("Website A", myAutogradient1); seriesElement1.getValues().add(new float[] { 5, 7, 9, 6 }); IndexedStackedColumnSeriesElement seriesElement2 = new IndexedStackedColumnSeriesElement("Website B", myAutogradient2); seriesElement2.getValues().add(new float[] { 4, 2, 5, 8 }); IndexedStackedColumnSeriesElement seriesElement3 = new IndexedStackedColumnSeriesElement("Website C", myAutogradient3); seriesElement3.getValues().add(new float[] { 2, 4, 6, 9 }); // Create a Indexed Stacked Column Series IndexedStackedColumnSeries columnSeries = new IndexedStackedColumnSeries(); // Add indexed stacked column series elements to the Indexed Stacked Column Series columnSeries.add(seriesElement1); columnSeries.add(seriesElement2); columnSeries.add(seriesElement3); // Add series to the plot area plotArea.getSeries().add(columnSeries); // Create a title and add it to the yaxis Title lTitle = new Title("Visitors (in millions)"); columnSeries.getYAxis().getTitles().add(lTitle); //Adding AxisLabels to the XAxis columnSeries.getXAxis().getLabels().add(new IndexedXAxisLabel("Q1", 0)); columnSeries.getXAxis().getLabels().add(new IndexedXAxisLabel("Q2", 1)); columnSeries.getXAxis().getLabels().add(new IndexedXAxisLabel("Q3", 2)); columnSeries.getXAxis().getLabels().add(new IndexedXAxisLabel("Q4", 3)); // Add the chart to the page page.getElements().add(chart); // Save the PDF document.draw("[PhysicalPath]/MyDocument.pdf"); - 100% Stacked
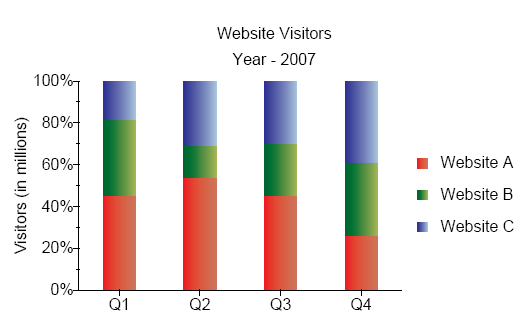
- 100% stacked charts are similar to stacked charts, but here the data is expressed as a percentage. They use DateTimeXAxis or IndexedXAxis as the XAxis based on the series and PercentageYAxis as the YAxis.
-
Figure 3 - Stacked 100% Column Chart
[Java]
    // Create a PDF Document
    Document document = new Document();
    // Create a Page and add it to the document
    Page page = new Page();
    document.getPages().add(page);

    // Create a chart
    Chart chart = new Chart(0, 0, 400, 230);
    // Create a plot area
    PlotArea plotArea = chart.getPrimaryPlotArea();

    // Create header titles and add it to the chart
    Title title1 = new Title("Website Visitors");
    Title title2 = new Title("Year - 2007");
    chart.getHeaderTitles().add(title1);
    chart.getHeaderTitles().add(title2);
    AutoGradient myAutogradient1 = new AutoGradient(180.0f, CmykColor.getRed(), CmykColor.getIndianRed())
    AutoGradient myAutogradient2 = new AutoGradient(180.0f, CmykColor.getGreen(), CmykColor.getYellowGreen())
    AutoGradient myAutogradient3 = new AutoGradient(180.0f, CmykColor.getBlue(), CmykColor.getLightBlue())
    // Create a indexed 100% column series elements and add values to it
    Indexed100PercentStackedColumnSeriesElement seriesElement1 = new Indexed100PercentStackedColumnSeriesElement("Website A", myAutogradient1);
    seriesElement1.getValues().add(new float[] { 5, 7, 9, 6 });
    Indexed100PercentStackedColumnSeriesElement seriesElement2 = new Indexed100PercentStackedColumnSeriesElement("Website B", myAutogradient2);
    seriesElement2.getValues().add(new float[] { 4, 2, 5, 8 });
    Indexed100PercentStackedColumnSeriesElement seriesElement3 = new Indexed100PercentStackedColumnSeriesElement("Website C", myAutogradient3) ;
    seriesElement3.getValues().add(new float[] { 2, 4, 6, 9 });
    // Create a Indexed 100% Stacked Column Series

    Indexed100PercentStackedColumnSeries columnSeries = new Indexed100PercentStackedColumnSeries();
    // Add indexed 100% column series elements to the Indexed 100% Stacked Column Series
    columnSeries.add(seriesElement1);
    columnSeries.add(seriesElement2);
    columnSeries.add(seriesElement3);
    // Add series to the plot area
    plotArea.getSeries().add(columnSeries);

    // Create a title and add it to the yaxis
    Title lTitle = new Title("Visitors (in millions)");
    columnSeries.getYAxis().getTitles().add(lTitle);

    //Adding AxisLabels to the XAxis
    columnSeries.getXAxis().getLabels().add(new IndexedXAxisLabel("Q1", 0));
    columnSeries.getXAxis().getLabels().add(new IndexedXAxisLabel("Q2", 1));
    columnSeries.getXAxis().getLabels().add(new IndexedXAxisLabel("Q3", 2));
    columnSeries.getXAxis().getLabels().add(new IndexedXAxisLabel("Q4", 3));

    // Add the chart to the page
    page.getElements().add(chart);
    // Save the PDF
    document.draw("[PhysicalPath]/MyDocument.pdf");
See Also