Area Chart
Area charts use polygons to display information using the Chart class. The following table lists the area series available to build area charts using Core Suite.
| Area Chart | Series |
|---|---|
| Normal | DateTimeAreaSeries, IndexedAreaSeries |
| Stacked | DateTimeStackedAreaSeries, IndexedStackedAreaSeries |
| 100% Stacked | DateTime100PercentStackedAreaSeries, Indexed100PercentStackedAreaSeries |
Normal
A normal area chart can use indexed or date/time series data. Normal area charts create polygons using data from a DateTimeAreaSeries or an IndexedAreaSeries. The chart places the values series values on either a DateTimeXAxis or an IndexedXAxis as the x-axis and a NumericYAxis as the y-axis.
Indexed
The following example illustrates a normal area chart with an IndexedAreaSeries as the data series. To create an indexed area series perform the following steps.
- Create the IndexedAreaSeries and assign values to it.
- Add the series to the primary plot area.
- Add a title to the y-axis.
- add labels to the x-axis (IndexedXAxisLabel).
- Add the chart to the page and create the PDF.
// Create a PDF Document
Document document = new Document();
// Create a Page and add it to the document
Page page = new Page();
document.Pages.Add(page);

// Create a chart
Chart chart = new Chart(0, 0, 400, 230);
// Create a plot area
PlotArea plotArea = chart.PrimaryPlotArea;

// Create header titles and add it to the chart
Title title1 = new Title("Website Visitors");
Title title2 = new Title("Year - 2007");
chart.HeaderTitles.Add(title1);
chart.HeaderTitles.Add(title2);

// Create indexed area series and add values to it
IndexedAreaSeries areaSeries1 = new IndexedAreaSeries("Website A");
areaSeries1.Values.Add(new float[]{5, 7, 9, 6});

// Create autogradient and assign it to series
AutoGradient autogradient1 = new AutoGradient(90f, CmykColor.Red, CmykColor.IndianRed);
areaSeries1.Color = autogradient1;

// Add indexed area series to the plot area
plotArea.Series.Add(areaSeries1);

// Create a title and add it to the YAxis
Title lTitle = new Title("Visitors (in millions)");
areaSeries1.YAxis.Titles.Add(lTitle);

//Adding AxisLabels to the XAxis
areaSeries1.XAxis.Labels.Add(new IndexedXAxisLabel("Q1", 0));
areaSeries1.XAxis.Labels.Add(new IndexedXAxisLabel("Q2", 1));
areaSeries1.XAxis.Labels.Add(new IndexedXAxisLabel("Q3", 2));
areaSeries1.XAxis.Labels.Add(new IndexedXAxisLabel("Q4", 3));

// Add the chart to the page
page.Elements.Add(chart);
// Save the PDF
document.Draw(pdfFilePath);
' Create a PDF Document
Dim MyDocument As New Document
' Create a Page and add it to the MyDocument
Dim MyPage As New Page
MyDocument.Pages.Add(MyPage)

' Create a MyChart
Dim MyChart As New Chart(0, 0, 400, 230)
' Create a plot area
Dim MyPlotArea As PlotArea = MyChart.PrimaryPlotArea

' Create header titles and add it to the MyChart
Dim MyTitle1 As New Title("Website Visitors")
Dim MyTitle2 As New Title("Year - 2007")
MyChart.HeaderTitles.Add(MyTitle1)
MyChart.HeaderTitles.Add(MyTitle2)

' Create indexed area series and add values to it
Dim MyAreaSeries1 As New IndexedAreaSeries("Website A")
MyAreaSeries1.Values.Add(New Single() {5, 7, 9, 6})

' Add autogradient colors to series
Dim MyAutogradient1 As AutoGradient = New AutoGradient(90.0F, CmykColor.Red, CmykColor.IndianRed)
MyAreaSeries1.Color = MyAutogradient1

' Add indexed area series to the plot area
MyPlotArea.Series.Add(MyAreaSeries1)

' Create a title and add it to the YAxis
Dim MylTitle As New Title("Visitors (in millions)")
MyAreaSeries1.YAxis.Titles.Add(MylTitle)

'Adding AxisLabels to the XAxis
MyAreaSeries1.XAxis.Labels.Add(New IndexedXAxisLabel("Q1", 0))
MyAreaSeries1.XAxis.Labels.Add(New IndexedXAxisLabel("Q2", 1))
MyAreaSeries1.XAxis.Labels.Add(New IndexedXAxisLabel("Q3", 2))
MyAreaSeries1.XAxis.Labels.Add(New IndexedXAxisLabel("Q4", 3))

' Add the MyChart to the MyPage
MyPage.Elements.Add(MyChart)
' Save the PDF
MyDocument.Draw(pdfFilePath)
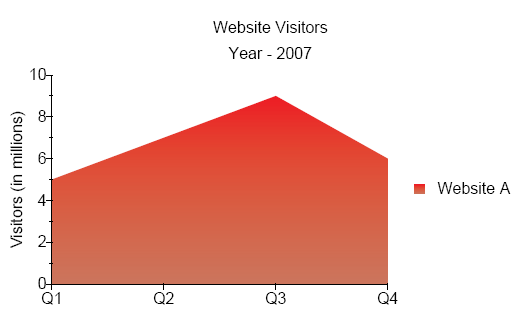 Figure 1. Normal area chart with indexed data.
Date/Time
The following example illustrates an area chart with an DateTimeAreaSeries as the data series. Perform the following steps to produce the chart.
Refer to Microsoft's documentation on date/time formats for more information on formatting date/time.
- Create three new DateTimeAreaSeries.
- Add values to each series, where each value also has a corresponding date/time.
- Add the three series to the plot area.
- Create the y-axis title.
- Set the date/time format for the x-axis labels.
- Add the chart to the page and create the PDF.
// Create a PDF Document
Document document = new Document();
// Create a Page and add it to the document
Page page = new Page();
document.Pages.Add(page);

// Create a chart
Chart chart = new Chart(0, 0, 400, 200);

// Get the default plot area from the chart
PlotArea plotArea = chart.PrimaryPlotArea;

// Create header titles and add it to the chart
Title title1 = new Title("Website Visitors");
Title title2 = new Title("Year - 2007");
chart.HeaderTitles.Add(title1);
chart.HeaderTitles.Add(title2);

// Create positions
DateTime p0 = new DateTime(2007, 1, 1);
DateTime p1 = new DateTime(2007, 2, 1);
DateTime p2 = new DateTime(2007, 3, 1);
DateTime p3 = new DateTime(2007, 4, 1);

// Create date time area series and add values to it
DateTimeAreaSeries areaSeries1 = new DateTimeAreaSeries("Website A");
areaSeries1.Values.Add(5, p0);
areaSeries1.Values.Add(7, p1);
areaSeries1.Values.Add(9, p2);
areaSeries1.Values.Add(6, p3);
DateTimeAreaSeries areaSeries2 = new DateTimeAreaSeries("Website B");
areaSeries2.Values.Add(4, p0);
areaSeries2.Values.Add(2, p1);
areaSeries2.Values.Add(5, p2);
areaSeries2.Values.Add(8, p3);
DateTimeAreaSeries areaSeries3 = new DateTimeAreaSeries("Website C");
areaSeries3.Values.Add(2, p0);
areaSeries3.Values.Add(4, p1);
areaSeries3.Values.Add(6, p2);
areaSeries3.Values.Add(9, p3);

//Add date time area series to the plot area
plotArea.Series.Add(areaSeries1);
plotArea.Series.Add(areaSeries2);
plotArea.Series.Add(areaSeries3);

// Create a title and add it to yAxis
Title title3 = new Title("Viewers (in millions)");
areaSeries1.YAxis.Titles.Add(title3);

// Set label  format for the axis labels
areaSeries1.XAxis.LabelFormat = "MMM";

//Add the chart to the page
page.Elements.Add(chart);

// Save the PDF
document.Draw(outputPath);
' Create a PDF Document
Dim MyDocument As Document = New Document()

' Create a Page and add it to the document
Dim MyPage As Page = New Page()
MyDocument.Pages.Add(MyPage)

' Create a chart
Dim MyChart As Chart = New Chart(0, 0, 400, 200)

' Get the default plot area from the chart
Dim MyPlotArea As PlotArea = MyChart.PrimaryPlotArea

' Create header titles and add it to the chart
Dim MyTitle1 As Title = New Title("Website Visitors")
Dim MyTitle2 As Title = New Title("Year - 2007")
MyChart.HeaderTitles.Add(MyTitle1)
MyChart.HeaderTitles.Add(MyTitle2)

' Create positions
Dim p0 As DateTime = New DateTime(2007, 1, 1)
Dim p1 As DateTime = New DateTime(2007, 2, 1)
Dim p2 As DateTime = New DateTime(2007, 3, 1)
Dim p3 As DateTime = New DateTime(2007, 4, 1)

' Create date time area series and add values to it
Dim MyAreaSeries1 As DateTimeAreaSeries = New DateTimeAreaSeries("Website A")
MyAreaSeries1.Values.Add(5, p0)
MyAreaSeries1.Values.Add(7, p1)
MyAreaSeries1.Values.Add(9, p2)
MyAreaSeries1.Values.Add(6, p3)
Dim MyAreaSeries2 As DateTimeAreaSeries = New DateTimeAreaSeries("Website B")
MyAreaSeries2.Values.Add(4, p0)
MyAreaSeries2.Values.Add(2, p1)
MyAreaSeries2.Values.Add(5, p2)
MyAreaSeries2.Values.Add(8, p3)
Dim MyAreaSeries3 As DateTimeAreaSeries = New DateTimeAreaSeries("Website C")
MyAreaSeries3.Values.Add(2, p0)
MyAreaSeries3.Values.Add(4, p1)
MyAreaSeries3.Values.Add(6, p2)
MyAreaSeries3.Values.Add(9, p3)

'Add date time area series to the plot area
MyPlotArea.Series.Add(MyAreaSeries1)
MyPlotArea.Series.Add(MyAreaSeries2)
MyPlotArea.Series.Add(MyAreaSeries3)

' Create a title and add it to yAxis
Dim MyTitle3 As Title = New Title("Viewers (in millions)")
MyAreaSeries1.YAxis.Titles.Add(MyTitle3)

' Set label  format for the axis labels
MyAreaSeries1.XAxis.LabelFormat = "MMM"

'Add the chart to the page
MyPage.Elements.Add(MyChart)

' Save the PDF
MyDocument.Draw("C:\MyDocument.pdf")
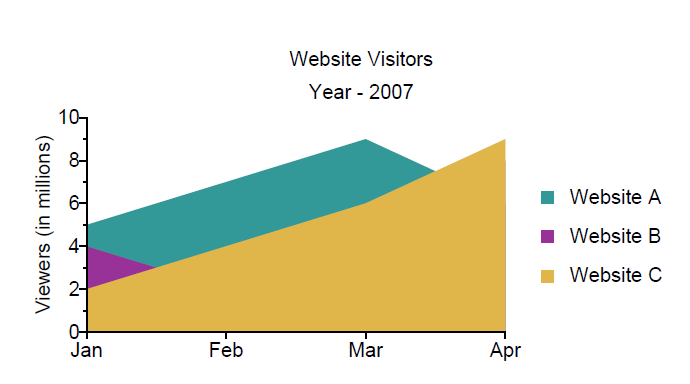 Figure 2. Normal area chart with date/time data.
Stacked
The DynamicPDF Core Suite for .NET also offers stacked area charts for both indexed and date/time series data. Stacked area charts display related data on top of one another and use data from either a DateTimeStackedAreaSeries or an IndexedStackedAreaSeries. The data series places the values using a DateTimeXAxis or an IndexedXAxis as the x-axis. The x-axis values use each series as the category (i.e., quarter) and data values for each series (i.e., visitors) as the y-axis using a NumericYAxis.
Indexed
The following example illustrates creating a stacked chart using indexed data. Perform the following steps to create a stacked chart using indexed data.
- Create an IndexedStackSeries instance.
- Create three IndexedStackSeriesElement instances and assign values to each.
- Add the elements to the series.
- Add a title to the y-axis.
- Add labels for each of the four values in each element instance.
- Add the series to the plot area.
- Add the chart to the page and create the PDF.
// Create a PDF Document
Document document = new Document();
// Create a Page and add it to the document
Page page = new Page();
document.Pages.Add(page);

// Create a chart
Chart chart = new Chart(0, 0, 400, 230);
// Create a plot area
PlotArea plotArea = chart.PrimaryPlotArea;

// Create header titles and add it to the chart
Title title1 = new Title("Website Visitors");
Title title2 = new Title("Year - 2007");
chart.HeaderTitles.Add(title1);
chart.HeaderTitles.Add(title2);

// Create a Indexed Stacked Area Series
IndexedStackedAreaSeries areaSeries = new IndexedStackedAreaSeries();

// Create indexed stacked area series elements and add values to it
IndexedStackedAreaSeriesElement seriesElement1 = new IndexedStackedAreaSeriesElement("Website A");
seriesElement1.Values.Add(new float[] { 5, 7, 9, 6 });
IndexedStackedAreaSeriesElement seriesElement2 = new IndexedStackedAreaSeriesElement("Website B");
seriesElement2.Values.Add(new float[] { 4, 2, 5, 8 });
IndexedStackedAreaSeriesElement seriesElement3 = new IndexedStackedAreaSeriesElement("Website C");
seriesElement3.Values.Add(new float[] { 2, 4, 6, 9 });

// Create autogradient and assign it to series
AutoGradient autogradient1 = new AutoGradient(90f, CmykColor.Red, CmykColor.IndianRed);
seriesElement1.Color = autogradient1;
AutoGradient autogradient2 = new AutoGradient(90f, CmykColor.Green, CmykColor.YellowGreen);
seriesElement2.Color = autogradient2;
AutoGradient autogradient3 = new AutoGradient(120f, CmykColor.Blue, CmykColor.LightBlue);
seriesElement3.Color = autogradient3;


// Add indexed stacked area series elements to the Indexed Stacked Area Series
areaSeries.Add(seriesElement1);
areaSeries.Add(seriesElement2);
areaSeries.Add(seriesElement3);

// Create a title and add it to the YAxis
Title lTitle = new Title("Visitors (in millions)");
areaSeries.YAxis.Titles.Add(lTitle);

//Adding AxisLabels to the XAxis
areaSeries.XAxis.Labels.Add(new IndexedXAxisLabel("Q1", 0));
areaSeries.XAxis.Labels.Add(new IndexedXAxisLabel("Q2", 1));
areaSeries.XAxis.Labels.Add(new IndexedXAxisLabel("Q3", 2));
areaSeries.XAxis.Labels.Add(new IndexedXAxisLabel("Q4", 3));

// Add series to the plot area
plotArea.Series.Add(areaSeries);

// Add the chart to the page
page.Elements.Add(chart);
// Save the PDF
document.Draw(pdfFilePath);
' Create a PDF Document
Dim MyDocument As New Document()

' Create a Page and add it to the MyDocument
Dim MyPage As New Page()
MyDocument.Pages.Add(MyPage)

' Create a MyChart
Dim MyChart As New Chart(0, 0, 400, 230)

' Create a plot area
Dim MyPlotArea As PlotArea = MyChart.PrimaryPlotArea

' Create header titles and add it to the MyChart
Dim MyTitle1 As New Title("Website Visitors")
Dim MyTitle2 As New Title("Year - 2007")
MyChart.HeaderTitles.Add(MyTitle1)
MyChart.HeaderTitles.Add(MyTitle2)

'Create indexed stacked are series elements and add values to it
Dim MySeriesElement1 As New IndexedStackedAreaSeriesElement("Website A")
MySeriesElement1.Values.Add(New Single() {5, 7, 9, 6})
Dim MySeriesElement2 As New IndexedStackedAreaSeriesElement("Website B")
MySeriesElement2.Values.Add(New Single() {4, 2, 5, 8})
Dim MySeriesElement3 As New IndexedStackedAreaSeriesElement("Website C")
MySeriesElement3.Values.Add(New Single() {2, 4, 6, 9})

' Add autogradient colors to series
Dim MyAutogradient1 As AutoGradient = New AutoGradient(90.0F, CmykColor.Red, CmykColor.IndianRed)
MySeriesElement1.Color = MyAutogradient1
Dim MyAutogradient2 As AutoGradient = New AutoGradient(90.0F, CmykColor.Green, CmykColor.YellowGreen)
MySeriesElement2.Color = MyAutogradient2
Dim MyAutogradient3 As AutoGradient = New AutoGradient(120.0F, CmykColor.Blue, CmykColor.LightBlue)
MySeriesElement3.Color = MyAutogradient3

' Create a Indexed Stacked Area Series
Dim MyAreaSeries As New IndexedStackedAreaSeries()

' Add indexed stacked area series elements to the Indexed Stacked Area Series
MyAreaSeries.Add(MySeriesElement1)
MyAreaSeries.Add(MySeriesElement2)
MyAreaSeries.Add(MySeriesElement3)

' Add series to the plot area
MyPlotArea.Series.Add(MyAreaSeries)

' Create a title and add it to the YAxis
Dim MylTitle As New Title("Visitors (in millions)")
MyAreaSeries.YAxis.Titles.Add(MylTitle)

'Adding AxisLabels to the XAxis
MyAreaSeries.XAxis.Labels.Add(New IndexedXAxisLabel("Q1", 0))
MyAreaSeries.XAxis.Labels.Add(New IndexedXAxisLabel("Q2", 1))
MyAreaSeries.XAxis.Labels.Add(New IndexedXAxisLabel("Q3", 2))
MyAreaSeries.XAxis.Labels.Add(New IndexedXAxisLabel("Q4", 3))

' Add the MyChart to the MyPage
MyPage.Elements.Add(MyChart)
' Save the PDF
MyDocument.Draw(pdfFilePath)
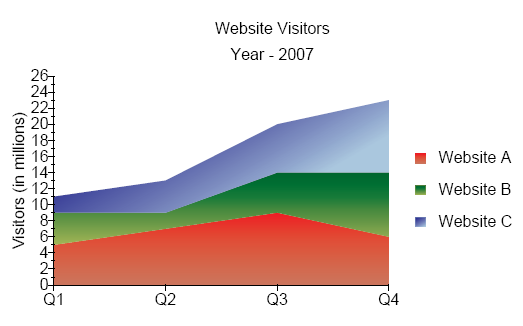
Figure 3. Stacked area chart with indexed data.
Date/Time
The following example illustrates a stacked area chart using date/time data. Perform the following steps to create the chart.
- Create three DateTimeStackedAreaSeriesElement instances and assign values and date/time values to each.
- Create a DateTimeStackedAreaSeries and add the elements to the series.
- Add a y-axis title.
- Set the date/time format for the x-axis labels.
- Add the series to the plot area.
- Add the chart to the page and produce the PDF.
// Create a PDF Document
Document document = new Document();

// Create a Page and add it to the document
Page page = new Page();
document.Pages.Add(page);

// Create a chart
Chart chart = new Chart(0, 0, 400, 200);

//Get the default plot area from the chart
PlotArea plotArea = chart.PrimaryPlotArea;

// Create header titles and add it to the chart
Title title1 = new Title("Website Visitors");
Title title2 = new Title("Year - 2007");
chart.HeaderTitles.Add(title1);
chart.HeaderTitles.Add(title2);

// Create a date time stacked area series element and add values to it
DateTimeStackedAreaSeriesElement seriesElement1 = new DateTimeStackedAreaSeriesElement("Website A");
seriesElement1.Values.Add(5, new DateTime(2007, 1, 1));
seriesElement1.Values.Add(7, new DateTime(2007, 2, 1));
seriesElement1.Values.Add(9, new DateTime(2007, 3, 1));
seriesElement1.Values.Add(6, new DateTime(2007, 4, 1));
DateTimeStackedAreaSeriesElement seriesElement2 = new DateTimeStackedAreaSeriesElement("Website B");
seriesElement2.Values.Add(4, new DateTime(2007, 1, 1));
seriesElement2.Values.Add(2, new DateTime(2007, 2, 1));
seriesElement2.Values.Add(5, new DateTime(2007, 3, 1));
seriesElement2.Values.Add(8, new DateTime(2007, 4, 1));
DateTimeStackedAreaSeriesElement seriesElement3 = new DateTimeStackedAreaSeriesElement("Website C");
seriesElement3.Values.Add(2, new DateTime(2007, 1, 1));
seriesElement3.Values.Add(4, new DateTime(2007, 2, 1));
seriesElement3.Values.Add(6, new DateTime(2007, 3, 1));
seriesElement3.Values.Add(9, new DateTime(2007, 4, 1));

// Create a date time stacked area series and add date time stacked area series elements to it
DateTimeStackedAreaSeries stackedAreaSeries1 = new DateTimeStackedAreaSeries();
stackedAreaSeries1.Add(seriesElement1);
stackedAreaSeries1.Add(seriesElement2);
stackedAreaSeries1.Add(seriesElement3);

// Add date time stacked area series to the plot area
plotArea.Series.Add(stackedAreaSeries1);

// Create a title and add it to the yAxis
Title title3 = new Title("Viewers (in millions)");
stackedAreaSeries1.YAxis.Titles.Add(title3);

// set label list format for the axis labels
stackedAreaSeries1.XAxis.LabelFormat = "MMM";

// Add the chart to the page
page.Elements.Add(chart);

// Save the PDF
document.Draw(outputPath);
Dim MyDocument As Document = New Document()

'Create a Page and add it to the document
Dim MyPage As Page = New Page()
MyDocument.Pages.Add(MyPage)

' Create a chart
Dim MyChart As Chart = New Chart(0, 0, 400, 200)

'Get the default plot area from the chart
Dim MyPlotArea As PlotArea = MyChart.PrimaryPlotArea

' Create header titles and add it to the chart
Dim MyTitle1 As Title = New Title("Website Visitors")
Dim MyTitle2 As Title = New Title("Year - 2007")
MyChart.HeaderTitles.Add(MyTitle1)
MyChart.HeaderTitles.Add(MyTitle2)

' Create a date time stacked area series element and add values to it
Dim MySeriesElement1 As DateTimeStackedAreaSeriesElement = New DateTimeStackedAreaSeriesElement("Website A")
MySeriesElement1.Values.Add(5, New DateTime(2007, 1, 1))
MySeriesElement1.Values.Add(7, New DateTime(2007, 2, 1))
MySeriesElement1.Values.Add(9, New DateTime(2007, 3, 1))
MySeriesElement1.Values.Add(6, New DateTime(2007, 4, 1))
Dim MySeriesElement2 As DateTimeStackedAreaSeriesElement = New DateTimeStackedAreaSeriesElement("Website B")
MySeriesElement2.Values.Add(4, New DateTime(2007, 1, 1))
MySeriesElement2.Values.Add(2, New DateTime(2007, 2, 1))
MySeriesElement2.Values.Add(5, New DateTime(2007, 3, 1))
MySeriesElement2.Values.Add(8, New DateTime(2007, 4, 1))
Dim MySeriesElement3 As DateTimeStackedAreaSeriesElement = New DateTimeStackedAreaSeriesElement("Website C")
MySeriesElement3.Values.Add(2, New DateTime(2007, 1, 1))
MySeriesElement3.Values.Add(4, New DateTime(2007, 2, 1))
MySeriesElement3.Values.Add(6, New DateTime(2007, 3, 1))
MySeriesElement3.Values.Add(9, New DateTime(2007, 4, 1))

' Create a date time stacked area series and add date time stacked area series elements to it
Dim MyStackedAreaSeries1 As DateTimeStackedAreaSeries = New DateTimeStackedAreaSeries()
MyStackedAreaSeries1.Add(MySeriesElement1)
MyStackedAreaSeries1.Add(MySeriesElement2)
MyStackedAreaSeries1.Add(MySeriesElement3)

' Add date time stacked area series to the plot area
MyPlotArea.Series.Add(MyStackedAreaSeries1)

' Create a title and add it to the yAxis
Dim MyTitle3 As Title = New Title("Viewers (in millions)")
MyStackedAreaSeries1.YAxis.Titles.Add(MyTitle3)

' set label  format for the axis labels
MyStackedAreaSeries1.XAxis.LabelFormat = "MMM"

' Add the chart to the page
MyPage.Elements.Add(MyChart)

' Save the PDF
MyDocument.Draw(outputPath)
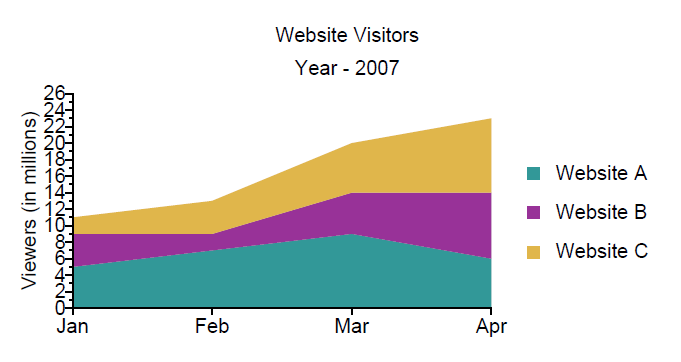
Figure 4. Stacked area chart with date/time data.
100% Stacked
100% stacked area charts are similar to stacked charts but express data as a percentage. These charts use either a DateTime100PercentStackedAreaSeries or an Indexed100PercentStackedAreaSeries. The data places the series along a DateTimeXAxis or an IndexedXAxis for the x-axis and a PercentageYAxis for the y-axis.
The following example illustrates creating a 100% stacked chart. Perform the following steps to create the chart.
- Create a Indexed100PercentStackedAreaSeries instance.
- Create three Indexed100PercentStackedAreaSeriesElement instances and assign values to each.
- Add the elements to the series.
- Add the series to the plot area.
- Add the chart to the page and create the PDF.
// Create a PDF Document
Document document = new Document();
// Create a Page and add it to the document
Page page = new Page();
document.Pages.Add(page);

// Create a chart
Chart chart = new Chart(0, 0, 400, 230);
// Create a plot area
PlotArea plotArea = chart.PrimaryPlotArea;

// Create header titles and add it to the chart
Title title1 = new Title("Website Visitors");
Title title2 = new Title("Year - 2007");
chart.HeaderTitles.Add(title1);
chart.HeaderTitles.Add(title2);

// Create a Indexed 100% Stacked Area Series
Indexed100PercentStackedAreaSeries areaSeries = new Indexed100PercentStackedAreaSeries();

// Create indexed 100% stacked area series elements and add values to it
Indexed100PercentStackedAreaSeriesElement seriesElement1 = new Indexed100PercentStackedAreaSeriesElement("Website A");
seriesElement1.Values.Add(new float[] { 5, 7, 9, 6 });
Indexed100PercentStackedAreaSeriesElement seriesElement2 = new Indexed100PercentStackedAreaSeriesElement("Website B");
seriesElement2.Values.Add(new float[] { 4, 2, 5, 8 });
Indexed100PercentStackedAreaSeriesElement seriesElement3 = new Indexed100PercentStackedAreaSeriesElement("Website C");
seriesElement3.Values.Add(new float[] { 2, 4, 6, 9 });

// Create autogradient and assign it to series
AutoGradient autogradient1 = new AutoGradient(90f, CmykColor.Red, CmykColor.IndianRed);
seriesElement1.Color = autogradient1;
AutoGradient autogradient2 = new AutoGradient(90f, CmykColor.Green, CmykColor.YellowGreen);
seriesElement2.Color = autogradient2;
AutoGradient autogradient3 = new AutoGradient(120f, CmykColor.Blue, CmykColor.LightBlue);
seriesElement3.Color = autogradient3;


// Add indexed 100% stacked area series elements to the Indexed 100% Stacked Area Series
areaSeries.Add(seriesElement1);
areaSeries.Add(seriesElement2);
areaSeries.Add(seriesElement3);

// Add series to the plot area
plotArea.Series.Add(areaSeries);

// Create a title and add it to the yAxis
Title lTitle = new Title("Visitors (in millions)");
areaSeries.YAxis.Titles.Add(lTitle);

//Adding AxisLabels to the XAxis
areaSeries.XAxis.Labels.Add(new IndexedXAxisLabel("Q1", 0));
areaSeries.XAxis.Labels.Add(new IndexedXAxisLabel("Q2", 1));
areaSeries.XAxis.Labels.Add(new IndexedXAxisLabel("Q3", 2));
areaSeries.XAxis.Labels.Add(new IndexedXAxisLabel("Q4", 3));

// Add the chart to the page
page.Elements.Add(chart);
// Save the PDF
document.Draw(outputPath);
Dim MyDocument As New Document()

' Create a Page and add it to the MyDocument
Dim MyPage As New Page()
MyDocument.Pages.Add(MyPage)

' Create a MyChart
Dim MyChart As New Chart(0, 0, 400, 230)

' Create a plot area
Dim MyPlotArea As PlotArea = MyChart.PrimaryPlotArea

' Create header titles and add it to the MyChart
Dim MyTitle1 As New Title("Website Visitors")
Dim MyTitle2 As New Title("Year - 2007")
MyChart.HeaderTitles.Add(MyTitle1)
MyChart.HeaderTitles.Add(MyTitle2)

' Create a indexed 100% stacked area series elements and add values to it
Dim MySeriesElement1 As New Indexed100PercentStackedAreaSeriesElement("Website A")
MySeriesElement1.Values.Add(New Single() {5, 7, 9, 6})
Dim MySeriesElement2 As New Indexed100PercentStackedAreaSeriesElement("Website B")
MySeriesElement2.Values.Add(New Single() {4, 2, 5, 8})
Dim MySeriesElement3 As New Indexed100PercentStackedAreaSeriesElement("Website C")
MySeriesElement3.Values.Add(New Single() {2, 4, 6, 9})

' Add autogradient colors to series
Dim MyAutogradient1 As AutoGradient = New AutoGradient(90.0F, CmykColor.Red, CmykColor.IndianRed)
MySeriesElement1.Color = MyAutogradient1
Dim MyAutogradient2 As AutoGradient = New AutoGradient(90.0F, CmykColor.Green, CmykColor.YellowGreen)
MySeriesElement2.Color = MyAutogradient2
Dim MyAutogradient3 As AutoGradient = New AutoGradient(120.0F, CmykColor.Blue, CmykColor.LightBlue)
MySeriesElement3.Color = MyAutogradient3

' Create a Indexed 100% Stacked Area Series
Dim MyAreaSeries As New Indexed100PercentStackedAreaSeries()

' Add indexed 100% stacked area series elements to the Indexed 100% Stacked Area Series
MyAreaSeries.Add(MySeriesElement1)
MyAreaSeries.Add(MySeriesElement2)
MyAreaSeries.Add(MySeriesElement3)

' Add series to the plot area
MyPlotArea.Series.Add(MyAreaSeries)

' Create a title and add it to the yAxis
Dim MylTitle As New Title("Visitors (in millions)")
MyAreaSeries.YAxis.Titles.Add(MylTitle)

'Adding AxisLabels to the XAxis
MyAreaSeries.XAxis.Labels.Add(New IndexedXAxisLabel("Q1", 0))
MyAreaSeries.XAxis.Labels.Add(New IndexedXAxisLabel("Q2", 1))
MyAreaSeries.XAxis.Labels.Add(New IndexedXAxisLabel("Q3", 2))
MyAreaSeries.XAxis.Labels.Add(New IndexedXAxisLabel("Q4", 3))

' Add the MyChart to the MyPage
MyPage.Elements.Add(MyChart)
' Save the PDF
MyDocument.Draw(outputPath)
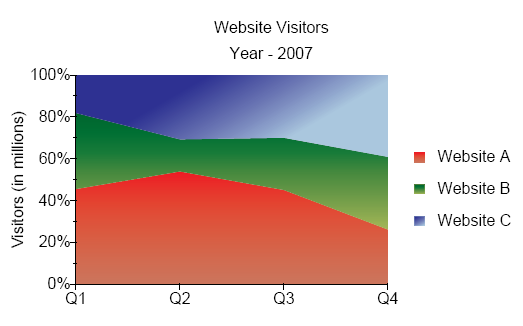
Figure 5. Stacked 100% Area Chart
Date/Time
The following example illustrates a stacked 100% area chart using date/time data. Perform the following steps to create the chart.
- Create a DateTime100PercentStackedAreaSeries instance.
- Create three DateTime100PercentStackedAreaSeriesElement instances and add values to each.
- Add the elements to the series and the series to the plot area.
- Add the chart to the page and produce the PDF.
// Create a PDF Document
 Document document = new Document();

// Create a Page and add it to the document
Page page = new Page();
document.Pages.Add(page);

// Create a chart
Chart chart = new Chart(0, 0, 400, 200);

//Get the default plot area from the chart
PlotArea plotArea = chart.PrimaryPlotArea;

// Create header titles and add it to the chart
Title title1 = new Title("Website Visitors");
Title title2 = new Title("Year - 2007");
chart.HeaderTitles.Add(title1);
chart.HeaderTitles.Add(title2);

// Create a date time 100 percent stacked area series
DateTime100PercentStackedAreaSeries stackedAreaSeries1 = new DateTime100PercentStackedAreaSeries();

// Create a date time 100 percent stacked area series element and add values to it
DateTime100PercentStackedAreaSeriesElement seriesElement1 = new DateTime100PercentStackedAreaSeriesElement("Website A");
seriesElement1.Values.Add(5, new DateTime(2007, 1, 1));
seriesElement1.Values.Add(7, new DateTime(2007, 2, 1));
seriesElement1.Values.Add(9, new DateTime(2007, 3, 1));
seriesElement1.Values.Add(6, new DateTime(2007, 4, 1));
DateTime100PercentStackedAreaSeriesElement seriesElement2 = new DateTime100PercentStackedAreaSeriesElement("Website B");
seriesElement2.Values.Add(4, new DateTime(2007, 1, 1));
seriesElement2.Values.Add(2, new DateTime(2007, 2, 1));
seriesElement2.Values.Add(5, new DateTime(2007, 3, 1));
seriesElement2.Values.Add(8, new DateTime(2007, 4, 1));
DateTime100PercentStackedAreaSeriesElement seriesElement3 = new DateTime100PercentStackedAreaSeriesElement("Website C");
seriesElement3.Values.Add(2, new DateTime(2007, 1, 1));
seriesElement3.Values.Add(4, new DateTime(2007, 2, 1));
seriesElement3.Values.Add(6, new DateTime(2007, 3, 1));
seriesElement3.Values.Add(9, new DateTime(2007, 4, 1));

//add date time 100 percent stacked area series elements to it

stackedAreaSeries1.Add(seriesElement1);
stackedAreaSeries1.Add(seriesElement2);
stackedAreaSeries1.Add(seriesElement3);

// Add date time 100 percent stacked area series to the plot area
plotArea.Series.Add(stackedAreaSeries1);

// set label  format for the axis labels
stackedAreaSeries1.XAxis.LabelFormat = "MMM";

// Add the chart to the page
page.Elements.Add(chart);

// Save the PDF
document.Draw(outputPath);
' Create a PDF Document
Dim MyDocument As Document = New Document()

' Create a Page and add it to the document
Dim MyPage As Page = New Page()
MyDocument.Pages.Add(MyPage)

' Create a chart
Dim MyChart As Chart = New Chart(0, 0, 400, 200)

' Get the default plot area from the chart
Dim MyPlotArea As PlotArea = MyChart.PrimaryPlotArea

' Create header titles and add it to the chart
Dim MyTitle1 As Title = New Title("Website Visitors")
Dim MyTitle2 As Title = New Title("Year - 2007")
MyChart.HeaderTitles.Add(MyTitle1)
MyChart.HeaderTitles.Add(MyTitle2)

' Create a date time 100 percent stacked area series element and add values to it
Dim MySeriesElement1 As DateTime100PercentStackedAreaSeriesElement = New DateTime100PercentStackedAreaSeriesElement("Website A")
MySeriesElement1.Values.Add(5, New DateTime(2007, 1, 1))
MySeriesElement1.Values.Add(7, New DateTime(2007, 2, 1))
MySeriesElement1.Values.Add(9, New DateTime(2007, 3, 1))
MySeriesElement1.Values.Add(6, New DateTime(2007, 4, 1))
Dim MySeriesElement2 As DateTime100PercentStackedAreaSeriesElement = New DateTime100PercentStackedAreaSeriesElement("Website B")
MySeriesElement2.Values.Add(4, New DateTime(2007, 1, 1))
MySeriesElement2.Values.Add(2, New DateTime(2007, 2, 1))
MySeriesElement2.Values.Add(5, New DateTime(2007, 3, 1))
MySeriesElement2.Values.Add(8, New DateTime(2007, 4, 1))
Dim MySeriesElement3 As DateTime100PercentStackedAreaSeriesElement = New DateTime100PercentStackedAreaSeriesElement("Website C")
MySeriesElement3.Values.Add(2, New DateTime(2007, 1, 1))
MySeriesElement3.Values.Add(4, New DateTime(2007, 2, 1))
MySeriesElement3.Values.Add(6, New DateTime(2007, 3, 1))
MySeriesElement3.Values.Add(9, New DateTime(2007, 4, 1))

' Create a date time 100 percent stacked area series and add date time 100 percent stacked area series elements to it
Dim MyStackedAreaSeries1 As DateTime100PercentStackedAreaSeries = New DateTime100PercentStackedAreaSeries()
MyStackedAreaSeries1.Add(MySeriesElement1)
MyStackedAreaSeries1.Add(MySeriesElement2)
MyStackedAreaSeries1.Add(MySeriesElement3)

' Add date time 100 percent stacked area series to the plot area
MyPlotArea.Series.Add(MyStackedAreaSeries1)

' set label  format for the axis labels
MyStackedAreaSeries1.XAxis.LabelFormat = "MMM"

' Add the chart to the page
MyPage.Elements.Add(MyChart)

' Save the PDF
MyDocument.Draw(outputPath)
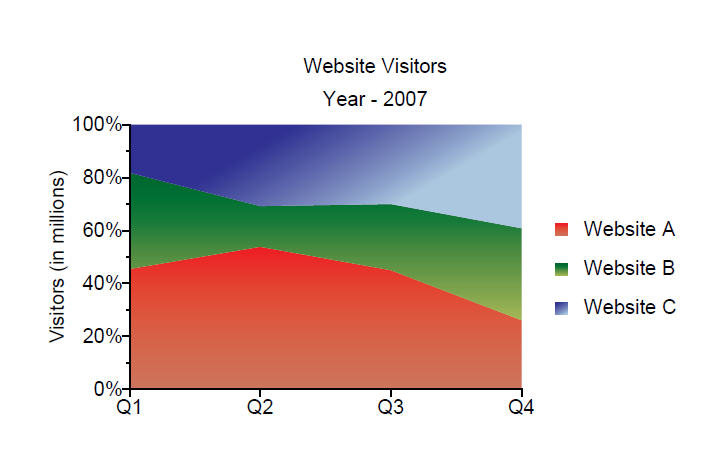
Figure 6. Stacked 100% area chart with date/time data.