Bar Chart
Bar charts use horizontal tetragons to display information as bars. There are three types of bar chart, normal, stacked, and 100% stacked.
There are nine types of bar series available to create bar charts. Of these, the BarSeries, StackedBarSeries, and Stacked100PercentBarSeries are parent classes to two subclasses, one for date/time data and one of indexed data.
| Normal | X-Axis | Y-Axis |
|---|---|---|
| BarSeries | ||
| DateTimeBarSeries | NumericXAxis | DateTimeYAxis |
| IndexedBarSeries | NumericXAxis | IndexedYAxis |
| Stacked | ||
| StackedBarSeries | ||
| DateTimeStackedBarSeries | NumericXAxis | DateTimeYAxis |
| IndexedStackedBarSeries | NumericXAxis | IndexedYAxis |
| 100% Stacked | ||
| Stacked100PercentBarSeries | ||
| DateTime100PercentStackedBarSeries | PercentageXAxis | DateTimeYAxis |
| Indexed100PercentStackedBarSeries | PercentageXAxis | DateTimeYAxis |
Normal
Normal bar charts create tetragons based on the data from a BarSeries. They use the DateTimeYAxis or IndexedYAxis as the y-axis (YAxis) and NumericXAxis as the x-axis (XAxis).
Indexed
The following example uses an IndexedBarSeries to create a bar chart with indexed data. Perform the following steps to create the chart.
- Create three IndexedBarSeries instances and add values to each.
- Add the series to the plot area.
- Add y-axis labels to each of the series (IndexedYAxisLabel).
- Add the chart to the page and produce the PDF.
// Create a PDF Document
Document document = new Document();
// Create a Page and add it to the document
Page page = new Page();
document.Pages.Add(page);

// Create a chart
Chart chart = new Chart(0, 0, 400, 230);
// Create a plot area
PlotArea plotArea = chart.PrimaryPlotArea;
// Create header titles and add it to the chart

Title title1 = new Title("Website Visitors");
Title title2 = new Title("Year 2007");
chart.HeaderTitles.Add(title1);
chart.HeaderTitles.Add(title2);

// Create a indexed bar series and add values to it
IndexedBarSeries barSeries1 = new IndexedBarSeries("Website A");
barSeries1.Values.Add(new float[] { 5, 7, 9, 6 });
IndexedBarSeries barSeries2 = new IndexedBarSeries("Website B");
barSeries2.Values.Add(new float[] { 4, 2, 5, 8 });
IndexedBarSeries barSeries3 = new IndexedBarSeries("Website C");
barSeries3.Values.Add(new float[] { 2, 4, 6, 9 });

// Create autogradient and assign it to series
AutoGradient autogradient1 = new AutoGradient(180f, CmykColor.Red, CmykColor.IndianRed);
barSeries1.Color = autogradient1;
AutoGradient autogradient2 = new AutoGradient(180f, CmykColor.Green, CmykColor.YellowGreen);
barSeries2.Color = autogradient2;
AutoGradient autogradient3 = new AutoGradient(180f, CmykColor.Blue, CmykColor.LightBlue);
barSeries3.Color = autogradient3;

// Add indexed bar series to the plot area
plotArea.Series.Add(barSeries1);
plotArea.Series.Add(barSeries2);
plotArea.Series.Add(barSeries3);

// Create a title and add it to the xaxis
Title lTitle = new Title("Visitors (in millions)");
barSeries1.XAxis.Titles.Add(lTitle);

//Adding AxisLabels to the yAxis
barSeries1.YAxis.Labels.Add(new IndexedYAxisLabel("Q1", 0));
barSeries1.YAxis.Labels.Add(new IndexedYAxisLabel("Q2", 1));
barSeries1.YAxis.Labels.Add(new IndexedYAxisLabel("Q3", 2));
barSeries1.YAxis.Labels.Add(new IndexedYAxisLabel("Q4", 3));

// Add the chart to the page
page.Elements.Add(chart);
// Save the PDF
document.Draw(outputPath);
' Create a PDF Document
Dim MyDocument As New Document()

' Create a Page and add it to the MyDocument
Dim MyPage As New Page()
MyDocument.Pages.Add(MyPage)

' Create a MyChart
Dim MyChart As New Chart(0, 0, 400, 230)

' Create a plot area
Dim MyPlotArea As PlotArea = MyChart.PrimaryPlotArea

' Create header titles and add it to the MyChart
Dim MyTitle1 As New Title("Website Visitors")
Dim MyTitle2 As New Title("Year 2007")
MyChart.HeaderTitles.Add(MyTitle1)
MyChart.HeaderTitles.Add(MyTitle2)

' Create a indexed bar series and add values to it
Dim MyBarSeries1 As New IndexedBarSeries("Website A")
MyBarSeries1.Values.Add(New Single() {5, 7, 9, 6})
Dim MyBarSeries2 As New IndexedBarSeries("Website B")
MyBarSeries2.Values.Add(New Single() {4, 2, 5, 8})
Dim MyBarSeries3 As New IndexedBarSeries("Website C")
MyBarSeries3.Values.Add(New Single() {2, 4, 6, 9})

' Create autogradient and assign it to series
Dim MyAutogradient1 As AutoGradient = New AutoGradient(180.0F, CmykColor.Red, CmykColor.IndianRed)
MyBarSeries1.Color = MyAutogradient1
Dim MyAutogradient2 As AutoGradient = New AutoGradient(180.0F, CmykColor.Green, CmykColor.YellowGreen)
MyBarSeries2.Color = MyAutogradient2
Dim MyAutogradient3 As AutoGradient = New AutoGradient(180.0F, CmykColor.Blue, CmykColor.LightBlue)
MyBarSeries3.Color = MyAutogradient3

' Add indexed bar series to the plot area
MyPlotArea.Series.Add(MyBarSeries1)
MyPlotArea.Series.Add(MyBarSeries2)
MyPlotArea.Series.Add(MyBarSeries3)

' Create a title and add it to the xaxis
Dim MylTitle As New Title("Visitors (in millions)")
MyBarSeries1.XAxis.Titles.Add(MylTitle)

'Adding AxisLabels to the yAxis
MyBarSeries1.YAxis.Labels.Add(New IndexedYAxisLabel("Q1", 0))
MyBarSeries1.YAxis.Labels.Add(New IndexedYAxisLabel("Q2", 1))
MyBarSeries1.YAxis.Labels.Add(New IndexedYAxisLabel("Q3", 2))
MyBarSeries1.YAxis.Labels.Add(New IndexedYAxisLabel("Q4", 3))

' Add the MyChart to the MyPage
MyPage.Elements.Add(MyChart)
' Save the PDF
MyDocument.Draw(outputPath)
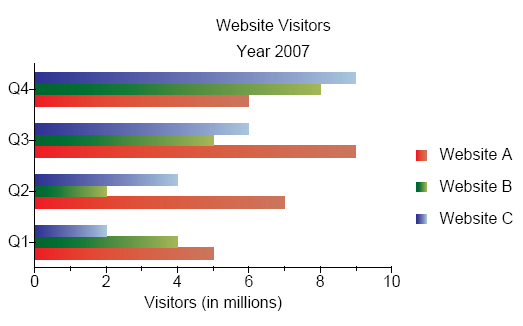
Figure 1. Normal bar chart using indexed data.
Date/Time
The following example illustrates a normal bar chart using date/time data. Perform the following steps to create the chart.
Refer to Microsoft's documentation on date/time formats for more information on formatting date/time.
- Create three DateTimeBarSeries instances and add values.
- Add the series to the plot area.
- Add the x-axis title and set the y-axis date/time format.
- Add the chart to the page and create the PDF.
// Create a PDF Document
Document document = new Document();

// Create a Page and add it to the document
Page page = new Page();
document.Pages.Add(page);

// Create a chart
Chart chart = new Chart(0, 0, 400, 200);

//Get the default plot area from the chart
PlotArea plotArea = chart.PrimaryPlotArea;

// Create header titles and add it to the chart
Title title1 = new Title("Website Visitors");
Title title2 = new Title("Year - 2007");
chart.HeaderTitles.Add(title1);
chart.HeaderTitles.Add(title2);

// Create a date time bar series and add values to it
DateTimeBarSeries barSeries1 = new DateTimeBarSeries("Website A");
barSeries1.Values.Add(5, new DateTime(2007, 1, 1));
barSeries1.Values.Add(7, new DateTime(2007, 2, 1));
barSeries1.Values.Add(9, new DateTime(2007, 3, 1));
barSeries1.Values.Add(6, new DateTime(2007, 4, 1));
DateTimeBarSeries barSeries2 = new DateTimeBarSeries("Website B");
barSeries2.Values.Add(4, new DateTime(2007, 1, 1));
barSeries2.Values.Add(2, new DateTime(2007, 2, 1));
barSeries2.Values.Add(5, new DateTime(2007, 3, 1));
barSeries2.Values.Add(8, new DateTime(2007, 4, 1));
DateTimeBarSeries barSeries3 = new DateTimeBarSeries("Website C");
barSeries3.Values.Add(2, new DateTime(2007, 1, 1));
barSeries3.Values.Add(4, new DateTime(2007, 2, 1));
barSeries3.Values.Add(6, new DateTime(2007, 3, 1));
barSeries3.Values.Add(9, new DateTime(2007, 4, 1));

// Add date time bar series to the plot area
plotArea.Series.Add(barSeries1);
plotArea.Series.Add(barSeries2);
plotArea.Series.Add(barSeries3);

// Create a title and add it to the XAxis
Title title3 = new Title("Viewers (in millions)");
barSeries1.XAxis.Titles.Add(title3);

// set label  format for the axis labels
barSeries1.YAxis.LabelFormat = "MMM";

// Add the chart to the page
page.Elements.Add(chart);

// Save the PDF
document.Draw(outputPath);
' Create a PDF Document
Dim MyDocument As Document = New Document()

' Create a Page and add it to the document
Dim MyPage As Page = New Page()
MyDocument.Pages.Add(MyPage)

' Create a chart
Dim MyChart As Chart = New Chart(0, 0, 400, 200)

'Get the default plot area from the chart
Dim MyPlotArea As PlotArea = MyChart.PrimaryPlotArea

' Create header titles and add it to the chart
Dim MyTitle1 As Title = New Title("Website Visitors")
Dim MyTitle2 As Title = New Title("Year - 2007")
MyChart.HeaderTitles.Add(MyTitle1)
MyChart.HeaderTitles.Add(MyTitle2)

' Create a date time bar series and add values to it
Dim MyBarSeries1 As DateTimeBarSeries = New DateTimeBarSeries("Website A")
MyBarSeries1.Values.Add(5, New DateTime(2007, 1, 1))
MyBarSeries1.Values.Add(7, New DateTime(2007, 2, 1))
MyBarSeries1.Values.Add(9, New DateTime(2007, 3, 1))
MyBarSeries1.Values.Add(6, New DateTime(2007, 4, 1))
Dim MyBarSeries2 As DateTimeBarSeries = New DateTimeBarSeries("Website B")
MyBarSeries2.Values.Add(4, New DateTime(2007, 1, 1))
MyBarSeries2.Values.Add(2, New DateTime(2007, 2, 1))
MyBarSeries2.Values.Add(5, New DateTime(2007, 3, 1))
MyBarSeries2.Values.Add(8, New DateTime(2007, 4, 1))
Dim MyBarSeries3 As DateTimeBarSeries = New DateTimeBarSeries("Website C")
MyBarSeries3.Values.Add(2, New DateTime(2007, 1, 1))
MyBarSeries3.Values.Add(4, New DateTime(2007, 2, 1))
MyBarSeries3.Values.Add(6, New DateTime(2007, 3, 1))
MyBarSeries3.Values.Add(9, New DateTime(2007, 4, 1))

' Add date time bar series to the plot area
MyPlotArea.Series.Add(MyBarSeries1)
MyPlotArea.Series.Add(MyBarSeries2)
MyPlotArea.Series.Add(MyBarSeries3)

' Create a title and add it to the XAxis
Dim MyTitle3 As Title = New Title("Viewers (in millions)")
MyBarSeries1.XAxis.Titles.Add(MyTitle3)

' set label  format for the axis labels
MyBarSeries1.YAxis.LabelFormat = "MMM"

' Add the chart to the page
MyPage.Elements.Add(MyChart)

' Save the PDF
MyDocument.Draw(outputPath)
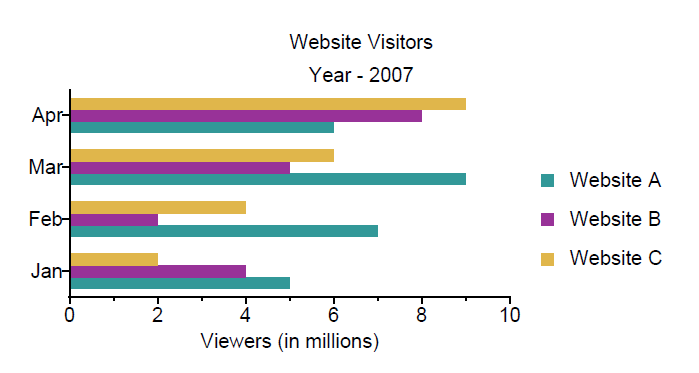 Figure 2. Normal bar chart using date/time data.
Stacked
Stacked charts display related data, one on top of the other. They use DateTimeYAxis or IndexedYAxis as the y-axis (YAxis) based on the series and NumericXAxis as the x-axis (XAxis).
Indexed
The following example uses an IndexedStackSeries to create a bar chart based on indexed data. Perform the following step to create the chart.
- Create the IndexedStackedBarSeries instance.
- Create three IndexedStackedBarSeriesElement and add values to each.
- Add the elements to the series.
- Add the series to the plot area.
- Add the y-axis labels (IndexedYAxisLabel).
- Add the chart to the page and create the PDF.
// Create a PDF Document
Document document = new Document();
// Create a Page and add it to the document
Page page = new Page();
document.Pages.Add(page);

// Create a chart
Chart chart = new Chart(0, 0, 400, 230);
// Create a plot area
PlotArea plotArea = chart.PrimaryPlotArea;

// Create header titles and add it to the chart
Title title1 = new Title("Website Visitors");
Title title2 = new Title("Year 2007");
chart.HeaderTitles.Add(title1);
chart.HeaderTitles.Add(title2);

// Create a Indexed Stacked Bar Series
IndexedStackedBarSeries barSeries = new IndexedStackedBarSeries();

// Create a indexed stacked bar series elements and add values to it
IndexedStackedBarSeriesElement seriesElement1 = new IndexedStackedBarSeriesElement("Website A");
seriesElement1.Values.Add(new float[] { 5, 7, 9, 6 });
IndexedStackedBarSeriesElement seriesElement2 = new IndexedStackedBarSeriesElement("Website B");
seriesElement2.Values.Add(new float[] { 4, 2, 5, 8 });
IndexedStackedBarSeriesElement seriesElement3 = new IndexedStackedBarSeriesElement("Website C");
seriesElement3.Values.Add(new float[] { 2, 4, 6, 9 });

// Create autogradient and assign it to series
AutoGradient autogradient1 = new AutoGradient(180f, CmykColor.Red, CmykColor.IndianRed);
seriesElement1.Color = autogradient1;
AutoGradient autogradient2 = new AutoGradient(180f, CmykColor.Green, CmykColor.YellowGreen);
seriesElement2.Color = autogradient2;
AutoGradient autogradient3 = new AutoGradient(180f, CmykColor.Blue, CmykColor.LightBlue);
seriesElement3.Color = autogradient3;

// Add indexed stacked bar series elements to the Indexed Stacked Bar Series
barSeries.Add(seriesElement1);
barSeries.Add(seriesElement2);
barSeries.Add(seriesElement3);
//Add series to the plot area
plotArea.Series.Add(barSeries);

// Create a title and add it to the xaxis
Title lTitle = new Title("Visitors (in millions)");
barSeries.XAxis.Titles.Add(lTitle);

//Adding AxisLabels to the yaxis
barSeries.YAxis.Labels.Add(new IndexedYAxisLabel("Q1", 0));
barSeries.YAxis.Labels.Add(new IndexedYAxisLabel("Q2", 1));
barSeries.YAxis.Labels.Add(new IndexedYAxisLabel("Q3", 2));
barSeries.YAxis.Labels.Add(new IndexedYAxisLabel("Q4", 3));

// Add the chart to the page
page.Elements.Add(chart);
// Save the PDF
document.Draw(pdfFilePath);
' Create a PDF Document
Dim MyDocument As New Document()
' Create a Page and add it to the MyDocument
Dim MyPage As New Page()
MyDocument.Pages.Add(MyPage)

' Create a MyChart
Dim MyChart As New Chart(0, 0, 400, 230)
' Create a plot area
Dim MyPlotArea As PlotArea = MyChart.PrimaryPlotArea

' Create header titles and add it to the chartdim
Dim MyTitle1 As New Title("Website Visitors")
Dim MyTitle2 As New Title("Year 2007")
MyChart.HeaderTitles.Add(MyTitle1)
MyChart.HeaderTitles.Add(MyTitle2)

' Create a indexed stacked bar series elements and add values to it
Dim MySeriesElement1 As New IndexedStackedBarSeriesElement("Website A")
MySeriesElement1.Values.Add(New Single() {5, 7, 9, 6})
Dim MySeriesElement2 As New IndexedStackedBarSeriesElement("Website B")
MySeriesElement2.Values.Add(New Single() {4, 2, 5, 8})
Dim MySeriesElement3 As New IndexedStackedBarSeriesElement("Website C")
MySeriesElement3.Values.Add(New Single() {2, 4, 6, 9})

' Create autogradient and assign it to series
Dim MyAutogradient1 As AutoGradient = New AutoGradient(180.0F, CmykColor.Red, CmykColor.IndianRed)
MySeriesElement1.Color = MyAutogradient1
Dim MyAutogradient2 As AutoGradient = New AutoGradient(180.0F, CmykColor.Green, CmykColor.YellowGreen)
MySeriesElement2.Color = MyAutogradient2
Dim MyAutogradient3 As AutoGradient = New AutoGradient(180.0F, CmykColor.Blue, CmykColor.LightBlue)
MySeriesElement3.Color = MyAutogradient3

' Create a Indexed Stacked Bar Series
Dim MyBarSeries As New IndexedStackedBarSeries()

' Add indexed stacked bar series elements to the Indexed Stacked Bar Series
MyBarSeries.Add(MySeriesElement1)
MyBarSeries.Add(MySeriesElement2)
MyBarSeries.Add(MySeriesElement3)

'Add series to the plot area
MyPlotArea.Series.Add(MyBarSeries)

' Create a title and add it to the xaxis
Dim MylTitle As New Title("Visitors (in millions)")
MyBarSeries.XAxis.Titles.Add(MylTitle)

'Adding AxisLabels to the yaxis
MyBarSeries.YAxis.Labels.Add(New IndexedYAxisLabel("Q1", 0))
MyBarSeries.YAxis.Labels.Add(New IndexedYAxisLabel("Q2", 1))
MyBarSeries.YAxis.Labels.Add(New IndexedYAxisLabel("Q3", 2))
MyBarSeries.YAxis.Labels.Add(New IndexedYAxisLabel("Q4", 3))

' Add the MyChart to the MyPage
MyPage.Elements.Add(MyChart)

' Save the PDF
MyDocument.Draw(outputPath)
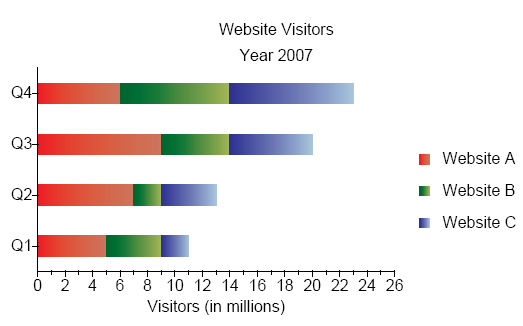
Figure 3. Stacked bar chart using indexed data.
Date/Time
The following example illustrates a stacked bar chart using date/time data. Perform the following steps to create the chart.
- Create a DateTimeStackedBarSeries instance.
- Create three DateTimeStackedBarSeriesElement instances and add values to each.
- Add the elements to the series.
- Add the series to the plot area.
- Add the chart to the page and produce the PDF.
// Create a PDF Document
Document document = new Document();

// Create a Page and add it to the document
Page page = new Page();
document.Pages.Add(page);

// Create a chart
Chart chart = new Chart(0, 0, 400, 200);

// Get the default plot area from the chart
PlotArea plotArea = chart.PrimaryPlotArea;

// Create header titles and add it to the chart
Title title1 = new Title("Website Visitors");
Title title2 = new Title("Year - 2007");
chart.HeaderTitles.Add(title1);
chart.HeaderTitles.Add(title2);

// Create a date time stacked bar series
DateTimeStackedBarSeries stackedBarSeries1 = new DateTimeStackedBarSeries();

// Create a date time stacked bar series element and add values to it

DateTimeStackedBarSeriesElement seriesElement1 = new DateTimeStackedBarSeriesElement("Website A");
seriesElement1.Values.Add(5, new DateTime(2007, 1, 1));
seriesElement1.Values.Add(7, new DateTime(2007, 2, 1));
seriesElement1.Values.Add(9, new DateTime(2007, 3, 1));
seriesElement1.Values.Add(6, new DateTime(2007, 4, 1));
DateTimeStackedBarSeriesElement seriesElement2 = new DateTimeStackedBarSeriesElement("Website B");
seriesElement2.Values.Add(4, new DateTime(2007, 1, 1));
seriesElement2.Values.Add(2, new DateTime(2007, 2, 1));
seriesElement2.Values.Add(5, new DateTime(2007, 3, 1));
seriesElement2.Values.Add(8, new DateTime(2007, 4, 1));
DateTimeStackedBarSeriesElement seriesElement3 = new DateTimeStackedBarSeriesElement("Website C");
seriesElement3.Values.Add(2, new DateTime(2007, 1, 1));
seriesElement3.Values.Add(4, new DateTime(2007, 2, 1));
seriesElement3.Values.Add(6, new DateTime(2007, 3, 1));
seriesElement3.Values.Add(9, new DateTime(2007, 4, 1));

//add date time stacked bar series elements to it

stackedBarSeries1.Add(seriesElement1);
stackedBarSeries1.Add(seriesElement2);
stackedBarSeries1.Add(seriesElement3);

// Add date time stacked bar series to the plot area
plotArea.Series.Add(stackedBarSeries1);

// Create a title and add it to the XAxis
Title title3 = new Title("Viewers");
stackedBarSeries1.XAxis.Titles.Add(title3);

// Set label  format for axis labels
stackedBarSeries1.YAxis.LabelFormat = "MMM";

// Add the chart to the page
page.Elements.Add(chart);

// Save the PDF
document.Draw(outputPath);
' Create a PDF Document
Dim MyDocument As Document = New Document()

' Create a Page and add it to the document
Dim MyPage As Page = New Page()
MyDocument.Pages.Add(MyPage)

' Create a chart
Dim MyChart As Chart = New Chart(0, 0, 400, 200)

' Get the default plot area from the chart
Dim MyPlotArea As PlotArea = MyChart.PrimaryPlotArea

' Create header titles and add it to the chart
Dim MyTitle1 As Title = New Title("Website Visitors")
Dim MyTitle2 As Title = New Title("Year - 2007")
MyChart.HeaderTitles.Add(MyTitle1)
MyChart.HeaderTitles.Add(MyTitle2)

' Create a date time stacked bar series element and add values to it
Dim MySeriesElement1 As DateTimeStackedBarSeriesElement = New DateTimeStackedBarSeriesElement("Website A")
MySeriesElement1.Values.Add(5, New DateTime(2007, 1, 1))
MySeriesElement1.Values.Add(7, New DateTime(2007, 2, 1))
MySeriesElement1.Values.Add(9, New DateTime(2007, 3, 1))
MySeriesElement1.Values.Add(6, New DateTime(2007, 4, 1))
Dim MySeriesElement2 As DateTimeStackedBarSeriesElement = New DateTimeStackedBarSeriesElement("Website B")
MySeriesElement2.Values.Add(4, New DateTime(2007, 1, 1))
MySeriesElement2.Values.Add(2, New DateTime(2007, 2, 1))
MySeriesElement2.Values.Add(5, New DateTime(2007, 3, 1))
MySeriesElement2.Values.Add(8, New DateTime(2007, 4, 1))
Dim MySeriesElement3 As DateTimeStackedBarSeriesElement = New DateTimeStackedBarSeriesElement("Website C")
MySeriesElement3.Values.Add(2, New DateTime(2007, 1, 1))
MySeriesElement3.Values.Add(4, New DateTime(2007, 2, 1))
MySeriesElement3.Values.Add(6, New DateTime(2007, 3, 1))
MySeriesElement3.Values.Add(9, New DateTime(2007, 4, 1))

' Create a date time stacked bar series and add date time stacked bar series elements to it
Dim MyStackedBarSeries1 As DateTimeStackedBarSeries = New DateTimeStackedBarSeries()
MyStackedBarSeries1.Add(MySeriesElement1)
MyStackedBarSeries1.Add(MySeriesElement2)
MyStackedBarSeries1.Add(MySeriesElement3)

' Add date time stacked bar series to the plot area
MyPlotArea.Series.Add(MyStackedBarSeries1)

' Create a title and add it to the XAxis
Dim MyTitle3 As Title = New Title("Viewers")
MyStackedBarSeries1.XAxis.Titles.Add(MyTitle3)

' Set label  format for axis labels
MyStackedBarSeries1.YAxis.LabelFormat = "MMM"

' Add the chart to the page
MyPage.Elements.Add(MyChart)

' Save the PDF
MyDocument.Draw(outputPath)
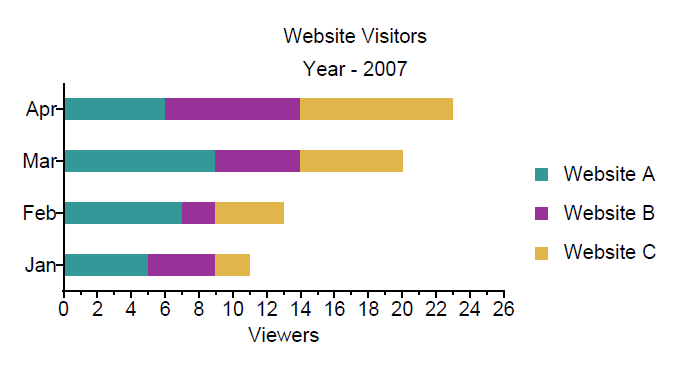 Figure 4. Stacked bar chart using date/time data.
100% Stacked
100% stacked charts are similar to stacked charts, but the data is expressed as a percentage. These charts use DateTimeYAxis or IndexedYAxis as the y-axis (YAxis) based on the series and PercentageXAxis as the x-axis (XAxis).
Indexed
The following example uses an Indexed100PercentStackedBarSeries to create a bar chart based on percentage indexed data. Perform the following steps to create the chart.
- Create a Indexed100PercentStackedBarSeries instance.
- Create three Indexed100PercentStackedBarSeriesElement instances and add values to each.
- Add the elements to the series.
- Add the x-axis title and the y-axis labels (IndexedYAxisLabel).
- Add the series to the plot area.
- Add the chart to the page and produce the PDF.
// Create a PDF Document
Document document = new Document();
// Create a Page and add it to the document
Page page = new Page();
document.Pages.Add(page);

// Create a chart
Chart chart = new Chart(0, 0, 400, 230);
// Create a plot area
PlotArea plotArea = chart.PrimaryPlotArea;

// Create header titles and add it to the chart
Title title1 = new Title("Website Visitors");
Title title2 = new Title("Year 2007");
chart.HeaderTitles.Add(title1);
chart.HeaderTitles.Add(title2);

// Create a Indexed 100% Stacked Bar Series
Indexed100PercentStackedBarSeries barSeries = new Indexed100PercentStackedBarSeries();

// Create a indexed 100% bar series elements and add values to it
Indexed100PercentStackedBarSeriesElement seriesElement1 = new Indexed100PercentStackedBarSeriesElement("Website A");
seriesElement1.Values.Add(new float[] { 5, 7, 9, 6 });
Indexed100PercentStackedBarSeriesElement seriesElement2 = new Indexed100PercentStackedBarSeriesElement("Website B");
seriesElement2.Values.Add(new float[] { 4, 2, 5, 8 });
Indexed100PercentStackedBarSeriesElement seriesElement3 = new Indexed100PercentStackedBarSeriesElement("Website C");
seriesElement3.Values.Add(new float[] { 2, 4, 6, 9 });

// Create autogradient and assign it to series
AutoGradient autogradient1 = new AutoGradient(180f, CmykColor.Red, CmykColor.IndianRed);
seriesElement1.Color = autogradient1;
AutoGradient autogradient2 = new AutoGradient(180f, CmykColor.Green, CmykColor.YellowGreen);
seriesElement2.Color = autogradient2;
AutoGradient autogradient3 = new AutoGradient(180f, CmykColor.Blue, CmykColor.LightBlue);
seriesElement3.Color = autogradient3;


// Add SeriesElements to the Indexed 100% Stacked Bar Series
barSeries.Add(seriesElement1);
barSeries.Add(seriesElement2);
barSeries.Add(seriesElement3);
// Add series to the plot area
plotArea.Series.Add(barSeries);

// Create a title and add it to the xaxis
Title lTitle = new Title("Visitors (in millions)");
barSeries.XAxis.Titles.Add(lTitle);

//Adding AxisLabels to the yaxis
barSeries.YAxis.Labels.Add(new IndexedYAxisLabel("Q1", 0));
barSeries.YAxis.Labels.Add(new IndexedYAxisLabel("Q2", 1));
barSeries.YAxis.Labels.Add(new IndexedYAxisLabel("Q3", 2));
barSeries.YAxis.Labels.Add(new IndexedYAxisLabel("Q4", 3));

//Add the chart to the page
page.Elements.Add(chart);
// Save the PDF
document.Draw(outputPath);
' Create a PDF Document
Dim MyDocument As New Document()
' Create a Page and add it to the MyDocument
Dim MyPage As New Page()
MyDocument.Pages.Add(MyPage)

' Create a MyChart
Dim MyChart As New Chart(0, 0, 400, 230)
' Create a plot area
Dim MyPlotArea As PlotArea = MyChart.PrimaryPlotArea

' Create header titles and add it to the MyChart
Dim MyTitle1 As New Title("Website Visitors")
Dim MyTitle2 As New Title("Year 2007")
MyChart.HeaderTitles.Add(MyTitle1)
MyChart.HeaderTitles.Add(MyTitle2)

' Create a indexed 100% bar series elements and add values to it
Dim MySeriesElement1 As New Indexed100PercentStackedBarSeriesElement("Website A")
MySeriesElement1.Values.Add(New Single() {5, 7, 9, 6})
Dim MySeriesElement2 As New Indexed100PercentStackedBarSeriesElement("Website B")
MySeriesElement2.Values.Add(New Single() {4, 2, 5, 8})
Dim MySeriesElement3 As New Indexed100PercentStackedBarSeriesElement("Website C")
MySeriesElement3.Values.Add(New Single() {2, 4, 6, 9})

' Create autogradient and assign it to series
Dim MyAutogradient1 As AutoGradient = New AutoGradient(180.0F, CmykColor.Red, CmykColor.IndianRed)
MySeriesElement1.Color = MyAutogradient1
Dim MyAutogradient2 As AutoGradient = New AutoGradient(180.0F, CmykColor.Green, CmykColor.YellowGreen)
MySeriesElement2.Color = MyAutogradient2
Dim MyAutogradient3 As AutoGradient = New AutoGradient(180.0F, CmykColor.Blue, CmykColor.LightBlue)
MySeriesElement3.Color = MyAutogradient3

' Create a Indexed 100% Stacked Bar Series
Dim MyBarSeries = New Indexed100PercentStackedBarSeries()
' Add SeriesElements to the Indexed 100% Stacked Bar Series
MyBarSeries.Add(MySeriesElement1)
MyBarSeries.Add(MySeriesElement2)
MyBarSeries.Add(MySeriesElement3)
' Add series to the plot area
MyPlotArea.Series.Add(MyBarSeries)

'Create a title and add it to the xaxis
Dim MylTitle As New Title("Visitors (in millions)")
MyBarSeries.XAxis.Titles.Add(MylTitle)

'Adding AxisLabels to the yaxis
MyBarSeries.YAxis.Labels.Add(New IndexedYAxisLabel("Q1", 0))
MyBarSeries.YAxis.Labels.Add(New IndexedYAxisLabel("Q2", 1))
MyBarSeries.YAxis.Labels.Add(New IndexedYAxisLabel("Q3", 2))
MyBarSeries.YAxis.Labels.Add(New IndexedYAxisLabel("Q4", 3))

'Add the MyChart to the MyPage
MyPage.Elements.Add(MyChart)
' Save the PDF
MyDocument.Draw(outputPath)
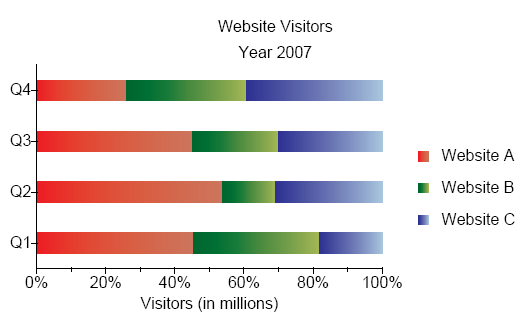
Figure 5. Stacked 100% bar chart using indexed data.
Date/Time
The following example illustrates a 100% stacked bar chart with date/time data. Perform the following steps to produce the chart.
- Create a DateTime100PercentStackedBarSeries instance.
- Create three DateTime100PercentStackedBarSeriesElement instances and add elements to each.
- Add the elements to the series and the series to the plot area.
- Add the x-axis title and the y-axis date/time label format.
- Add the chart to the page and produce the PDF.
// Create a PDF Document
Document document = new Document();

// Create a Page and add it to the document
Page page = new Page();
document.Pages.Add(page);

// Create a chart
Chart chart = new Chart(0, 0, 400, 200);

// Get the default plot area from the chart
PlotArea plotArea = chart.PrimaryPlotArea;

// Create header titles and add it to the chart
Title title1 = new Title("Website Visitors");
Title title2 = new Title("Year - 2007");
chart.HeaderTitles.Add(title1);
chart.HeaderTitles.Add(title2);

// Create a date time 100 percent stacked bar series
DateTime100PercentStackedBarSeries stackedBarSeries1 = new DateTime100PercentStackedBarSeries();

// Create a date time 100 percent stacked bar series element and add values to it
DateTime100PercentStackedBarSeriesElement seriesElement1 = new DateTime100PercentStackedBarSeriesElement("Website A");
seriesElement1.Values.Add(5, new DateTime(2007, 1, 1));
seriesElement1.Values.Add(7, new DateTime(2007, 2, 1));
seriesElement1.Values.Add(9, new DateTime(2007, 3, 1));
seriesElement1.Values.Add(6, new DateTime(2007, 4, 1));
DateTime100PercentStackedBarSeriesElement seriesElement2 = new DateTime100PercentStackedBarSeriesElement("Website B");
seriesElement2.Values.Add(4, new DateTime(2007, 1, 1));
seriesElement2.Values.Add(2, new DateTime(2007, 2, 1));
seriesElement2.Values.Add(5, new DateTime(2007, 3, 1));
seriesElement2.Values.Add(8, new DateTime(2007, 4, 1));
DateTime100PercentStackedBarSeriesElement seriesElement3 = new DateTime100PercentStackedBarSeriesElement("Website C");
seriesElement3.Values.Add(2, new DateTime(2007, 1, 1));
seriesElement3.Values.Add(4, new DateTime(2007, 2, 1));
seriesElement3.Values.Add(6, new DateTime(2007, 3, 1));
seriesElement3.Values.Add(9, new DateTime(2007, 4, 1));

//add date time 100 percent stacked bar series elements to it
stackedBarSeries1.Add(seriesElement1);
stackedBarSeries1.Add(seriesElement2);
stackedBarSeries1.Add(seriesElement3);

// Add date time stacked bar series to the plot area
plotArea.Series.Add(stackedBarSeries1);

// Create a title and add it to the XAxis
Title title3 = new Title("Viewers");
stackedBarSeries1.XAxis.Titles.Add(title3);

// Set label  format to the axis labels
stackedBarSeries1.YAxis.LabelFormat = "MMM";

// Add the chart to the page
page.Elements.Add(chart);

// Save the PDF
document.Draw(outputPath);
' Create a PDF Document
Dim MyDocument As Document = New Document()

' Create a Page and add it to the document
Dim MyPage As Page = New Page()
MyDocument.Pages.Add(MyPage)

' Create a chart
Dim MyChart As Chart = New Chart(0, 0, 400, 200)

' Get the default plot area from the chart
Dim MyPlotArea As PlotArea = MyChart.PrimaryPlotArea

' Create header titles and add it to the chart
Dim MyTitle1 As Title = New Title("Website Visitors")
Dim MyTitle2 As Title = New Title("Year - 2007")
MyChart.HeaderTitles.Add(MyTitle1)
MyChart.HeaderTitles.Add(MyTitle2)

' Create a date time 100 percent stacked bar series element and add values to it
Dim MySeriesElement1 As DateTime100PercentStackedBarSeriesElement = New DateTime100PercentStackedBarSeriesElement("Website A")
MySeriesElement1.Values.Add(5, New DateTime(2007, 1, 1))
MySeriesElement1.Values.Add(7, New DateTime(2007, 2, 1))
MySeriesElement1.Values.Add(9, New DateTime(2007, 3, 1))
MySeriesElement1.Values.Add(6, New DateTime(2007, 4, 1))
Dim MySeriesElement2 As DateTime100PercentStackedBarSeriesElement = New DateTime100PercentStackedBarSeriesElement("Website B")
MySeriesElement2.Values.Add(4, New DateTime(2007, 1, 1))
MySeriesElement2.Values.Add(2, New DateTime(2007, 2, 1))
MySeriesElement2.Values.Add(5, New DateTime(2007, 3, 1))
MySeriesElement2.Values.Add(8, New DateTime(2007, 4, 1))
Dim MySeriesElement3 As DateTime100PercentStackedBarSeriesElement = New DateTime100PercentStackedBarSeriesElement("Website C")
MySeriesElement3.Values.Add(2, New DateTime(2007, 1, 1))
MySeriesElement3.Values.Add(4, New DateTime(2007, 2, 1))
MySeriesElement3.Values.Add(6, New DateTime(2007, 3, 1))
MySeriesElement3.Values.Add(9, New DateTime(2007, 4, 1))

' Create a date time 100 percent stacked bar series and add date time 100 percent stacked bar series elements to it
Dim MyStackedBarSeries1 As DateTime100PercentStackedBarSeries = New DateTime100PercentStackedBarSeries()
MyStackedBarSeries1.Add(MySeriesElement1)
MyStackedBarSeries1.Add(MySeriesElement2)
MyStackedBarSeries1.Add(MySeriesElement3)

' Add date time 100 percent stacked bar series to the plot area
MyPlotArea.Series.Add(MyStackedBarSeries1)

' Create a title and add it to the XAxis
Dim MyTitle3 As Title = New Title("Viewers")
MyStackedBarSeries1.XAxis.Titles.Add(MyTitle3)

' Set label  format to the axis labels
MyStackedBarSeries1.YAxis.LabelFormat = "MMM"

' Add the chart to the page
MyPage.Elements.Add(MyChart)

' Save the PDF
MyDocument.Draw(outputPath)
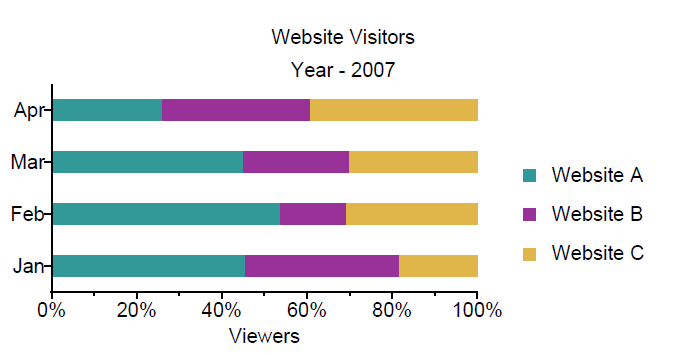 Figure 6. Stacked 100% bar chart using date/time data.