Grid Lines
GridLines are vertical and horizontal lines added in conjunction with tick marks on the x-axis (XAxis) and y-axis (YAxis), respectively. Adding grid lines help makes it easier to read and interpret chart data. There are two types of grid lines: XAxisGridLines and YAxisGridLines, both of which are inherited from the GridLines class.
GridLines
The GridLines class is the parent of XAxisGridLines and YAxisGridLines and has the following properties for customizing a gridline's appearance.
Properties
| Property | Description |
|---|---|
| Color | Gets or sets the Color object to use for the color of the grid lines. |
| Interval | Gets or sets the interval of the grid lines. |
| LineStyle | Gets or sets the LineStyle enumeration that specifies the line style of the grid lines. |
| Visible | Gets or sets the visible status of the grid lines on the plot area. By default it is True. |
| Width | Gets or sets the width of the grid lines. |
Customizing a gridline's appearance, such as thickness or color, requires customizing the axis tick marks if you wish for a consistent appearance.
XAxisGridLines
Add XAxisGridLines vertically to a plot area setting either the MajorGridLines or MinorGridLines property in XAxis. The major gridlines are placed at the same intervals as the x-axis major tick marks, and the minor gridlines are placed at the same intervals as the x-axis minor tick marks.
The following code illustrates adding XAxisGridLines.
Chart chart = new Chart(0, 0, 300, 200);
PlotArea plotArea = chart.PrimaryPlotArea;
plotArea.XAxes.DefaultNumericXAxis.MajorGridLines = new XAxisGridLines();
plotArea.XAxes.DefaultNumericXAxis.MinorGridLines = new XAxisGridLines();
Dim MyChart As Chart = New Chart(0, 0, 300, 200)
Dim MyPlotArea = MyChart.PrimaryPlotArea
MyPlotArea.XAxes.DefaultNumericXAxis.MajorGridLines = New XAxisGridLines()
MyPlotArea.XAxes.DefaultNumericXAxis.MinorGridLines = New XAxisGridLines()
YAxisGridLines
Add YAxisGridLines horizontally to a plot area setting either the MajorGridLines or MinorGridLines property in YAxis. Major gridlines are placed at the same intervals as the y-axis major tick marks, and the minor gridlines are placed at the same intervals as the y-axis minor tick marks.
The following code illustrates adding YAxisGridLines.
Chart chart = new Chart(0, 0, 300, 200);
PlotArea plotArea = chart.PrimaryPlotArea;
plotArea.YAxes.DefaultNumericYAxis.MajorGridLines = new YAxisGridLines();
plotArea.YAxes.DefaultNumericYAxis.MinorGridLines = new YAxisGridLines();
Dim MyChart As Chart = New Chart(0, 0, 300, 200)
Dim MyPlotArea = MyChart.PrimaryPlotArea
MyPlotArea.YAxes.DefaultNumericYAxis.MajorGridLines = New YAxisGridLines()
MyPlotArea.YAxes.DefaultNumericYAxis.MinorGridLines = New YAxisGridLines()
Example
The following illustrates creating grid lines for a line chart.
Document document = new();
document.Pages.Add(new Page(PageSize.Letter, PageOrientation.Landscape));
Chart chart = new Chart(0, 0, 500, 500);
IndexedLineSeries ls = new IndexedLineSeries("Website A");
ls.Values.Add(new float[] { 48, 83, 19, 23 });
IndexedLineSeries ls2 = new IndexedLineSeries("Website B");
ls2.Values.Add(new float[] { 52, 74, 9, 21 });
IndexedLineSeries ls3 = new IndexedLineSeries("Website C");
ls3.Values.Add(new float[] { 15, 43, 12, 8 });

chart.PrimaryPlotArea.Series.Add(ls);
chart.PrimaryPlotArea.Series.Add(ls2);
chart.PrimaryPlotArea.Series.Add(ls3);

Title title = new Title("Page Views");
ls.YAxis.Titles.Add(title);

ls.XAxis.Labels.Add(new IndexedXAxisLabel("Home", 0));
ls.XAxis.Labels.Add(new IndexedXAxisLabel("Examples", 1));
ls.XAxis.Labels.Add(new IndexedXAxisLabel("About", 2));
ls.XAxis.Labels.Add(new IndexedXAxisLabel("Ordering", 3));
chart.PrimaryPlotArea.XAxes.DefaultIndexedAxis.MajorGridLines = new XAxisGridLines();
chart.PrimaryPlotArea.XAxes.DefaultIndexedAxis.MinorGridLines = new XAxisGridLines();
chart.PrimaryPlotArea.YAxes.DefaultNumericAxis.MajorGridLines = new YAxisGridLines();
chart.PrimaryPlotArea.YAxes.DefaultNumericAxis.MajorTickMarks = new YAxisTickMarks();
chart.PrimaryPlotArea.YAxes.DefaultNumericAxis.MinorTickMarks = new YAxisTickMarks();
chart.PrimaryPlotArea.XAxes.DefaultIndexedAxis.MajorTickMarks = new XAxisTickMarks();
chart.PrimaryPlotArea.XAxes.DefaultIndexedAxis.MajorGridLines.Color = RgbColor.Navy;
chart.PrimaryPlotArea.XAxes.DefaultIndexedAxis.MajorGridLines.LineStyle = LineStyle.DashLarge;
chart.PrimaryPlotArea.XAxes.DefaultIndexedAxis.MinorGridLines.LineStyle = LineStyle.DashSmall;
chart.PrimaryPlotArea.XAxes.DefaultIndexedAxis.MinorGridLines.Color = RgbColor.LightBlue;
chart.PrimaryPlotArea.YAxes.DefaultNumericAxis.MajorGridLines.LineStyle = LineStyle.Solid;
chart.PrimaryPlotArea.YAxes.DefaultNumericAxis.MajorGridLines.Color = RgbColor.LightGrey;
chart.PrimaryPlotArea.YAxes.DefaultNumericAxis.MajorTickMarks.Color = RgbColor.LightGrey;
chart.PrimaryPlotArea.YAxes.DefaultNumericAxis.MinorTickMarss.Visible = false;
chart.PrimaryPlotArea.XAxes.DefaultIndexedAxis.MajorTickMarks.Visible = false;

Title title2 = new Title("Page");
ls.XAxis.Titles.Add(title2);
ls.XAxis.Labels.Angle = 45;
ls.XAxis.LabelOffset = 5;
ls.XAxis.Labels.TextColor = RgbColor.Green;
ls.XAxis.Labels.FontSize = 8;
ls.XAxis.TitlePosition = XAxisTitlePosition.AboveXAxis;
ls.XAxis.Titles[0].TextColor = RgbColor.Navy;

document.Pages[0].Elements.Add(chart);
document.Draw(outputPath);
Dim document As New Document()
document.Pages.Add(New Page(PageSize.Letter, PageOrientation.Landscape))

Dim chart As New Chart(0, 0, 500, 500)

Dim ls As New IndexedLineSeries("Website A")
ls.Values.Add(New Single() {48, 83, 19, 23})

Dim ls2 As New IndexedLineSeries("Website B")
ls2.Values.Add(New Single() {52, 74, 9, 21})

Dim ls3 As New IndexedLineSeries("Website C")
ls3.Values.Add(New Single() {15, 43, 12, 8})

chart.PrimaryPlotArea.Series.Add(ls)
chart.PrimaryPlotArea.Series.Add(ls2)
chart.PrimaryPlotArea.Series.Add(ls3)

Dim title As New Title("Page Views")
ls.YAxis.Titles.Add(title)

ls.XAxis.Labels.Add(New IndexedXAxisLabel("Home", 0))
ls.XAxis.Labels.Add(New IndexedXAxisLabel("Examples", 1))
ls.XAxis.Labels.Add(New IndexedXAxisLabel("About", 2))
ls.XAxis.Labels.Add(New IndexedXAxisLabel("Ordering", 3))

chart.PrimaryPlotArea.XAxes.DefaultIndexedAxis.MajorGridLines = New XAxisGridLines()
chart.PrimaryPlotArea.XAxes.DefaultIndexedAxis.MinorGridLines = New XAxisGridLines()
chart.PrimaryPlotArea.YAxes.DefaultNumericAxis.MajorGridLines = New YAxisGridLines()
chart.PrimaryPlotArea.YAxes.DefaultNumericAxis.MajorTickMarks = New YAxisTickMarks()
chart.PrimaryPlotArea.YAxes.DefaultNumericAxis.MinorTickMarks = New YAxisTickMarks()
chart.PrimaryPlotArea.XAxes.DefaultIndexedAxis.MajorTickMarks = New XAxisTickMarks()
chart.PrimaryPlotArea.XAxes.DefaultIndexedAxis.MajorGridLines.Color = RgbColor.Navy
chart.PrimaryPlotArea.XAxes.DefaultIndexedAxis.MajorGridLines.LineStyle = LineStyle.DashLarge
chart.PrimaryPlotArea.XAxes.DefaultIndexedAxis.MinorGridLines.LineStyle = LineStyle.DashSmall
chart.PrimaryPlotArea.XAxes.DefaultIndexedAxis.MinorGridLines.Color = RgbColor.LightBlue
chart.PrimaryPlotArea.YAxes.DefaultNumericAxis.MajorGridLines.LineStyle = LineStyle.Solid
chart.PrimaryPlotArea.YAxes.DefaultNumericAxis.MajorGridLines.Color = RgbColor.LightGrey
chart.PrimaryPlotArea.YAxes.DefaultNumericAxis.MajorTickMarks.Color = RgbColor.LightGrey
chart.PrimaryPlotArea.YAxes.DefaultNumericAxis.MinorTickMarks.Visible = False
chart.PrimaryPlotArea.XAxes.DefaultIndexedAxis.MajorTickMarks.Visible = False

Dim title2 As New Title("Page")
ls.XAxis.Titles.Add(title2)

ls.XAxis.Labels.Angle = 45
ls.XAxis.LabelOffset = 5
ls.XAxis.Labels.TextColor = RgbColor.Green
ls.XAxis.Labels.FontSize = 8
ls.XAxis.TitlePosition = XAxisTitlePosition.AboveXAxis
ls.XAxis.Titles(0).TextColor = RgbColor.Navy

document.Pages(0).Elements.Add(chart)
document.Draw(outputPath)
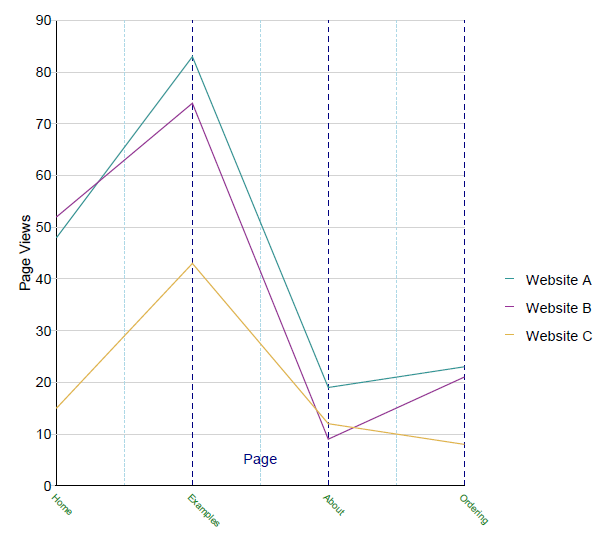
Figure 1. Line chart with grid lines.