Column Chart
Vertical tetragons are used to display information in column charts. There are three column chart types, Normal, Stacked, and 100% Stacked.
Normal
Normal column charts create tetragons based on the data. They use DateTimeXAxis or IndexedXAxis as the XAxis based on the series and NumericYAxis as the YAxis.
Indexed
The following example illustrates a column chart using indexed data.
// Create a PDF Document
Document document = new Document();
// Create a Page and add it to the document
Page page = new Page();
document.Pages.Add(page);

// Create a chart
Chart chart = new Chart(0, 0, 400, 230);
// Create a plot area
PlotArea plotArea = chart.PrimaryPlotArea;

// Create header titles and add it to the chart
Title title1 = new Title("Website Visitors");
Title title2 = new Title("Year - 2007");
chart.HeaderTitles.Add(title1);
chart.HeaderTitles.Add(title2);

// Create a indexed column series and add values to it
IndexedColumnSeries columnSeries1 = new IndexedColumnSeries("Website A");
columnSeries1.Values.Add(new float[] { 5, 7, 9, 6 });
IndexedColumnSeries columnSeries2 = new IndexedColumnSeries("Website B");
columnSeries2.Values.Add(new float[] { 4, 2, 5, 8 });
IndexedColumnSeries columnSeries3 = new IndexedColumnSeries("Website C");
columnSeries3.Values.Add(new float[] { 2, 4, 6, 9 });

// Create autogradient and assign it to series
AutoGradient autogradient1 = new AutoGradient(180f, CmykColor.Red, CmykColor.IndianRed);
columnSeries1.Color = autogradient1;
AutoGradient autogradient2 = new AutoGradient(180f, CmykColor.Green, CmykColor.YellowGreen);
columnSeries2.Color = autogradient2;
AutoGradient autogradient3 = new AutoGradient(180f, CmykColor.Blue, CmykColor.LightBlue);
columnSeries3.Color = autogradient3;

// Add indexed column series to the plot area
plotArea.Series.Add(columnSeries1);
plotArea.Series.Add(columnSeries2);
plotArea.Series.Add(columnSeries3);

// Create a title and add it to the yaxis
Title lTitle = new Title("Visitors (in millions)");
columnSeries1.YAxis.Titles.Add(lTitle);

//Adding AxisLabels to the XAxis
columnSeries1.XAxis.Labels.Add(new IndexedXAxisLabel("Q1", 0));
columnSeries1.XAxis.Labels.Add(new IndexedXAxisLabel("Q2", 1));
columnSeries1.XAxis.Labels.Add(new IndexedXAxisLabel("Q3", 2));
columnSeries1.XAxis.Labels.Add(new IndexedXAxisLabel("Q4", 3));

// Add the chart to the page
page.Elements.Add(chart);
// Save the PDF
document.Draw(pdfFilePath);
' Create a PDF Document
Dim MyDocument As New Document()
' Create a Page and add it to the MyDocument
Dim MyPage As New Page()
MyDocument.Pages.Add(MyPage)

' Create a MyChart
Dim MyChart As New Chart(0, 0, 400, 230)

' Create a plot area
Dim MyPlotArea As PlotArea = MyChart.PrimaryPlotArea

' Create header titles and add it to the MyChart
Dim MyTitle1 As New Title("Website Visitors")
Dim MyTitle2 As New Title("Year - 2007")
MyChart.HeaderTitles.Add(MyTitle1)
MyChart.HeaderTitles.Add(MyTitle2)

' Create a indexed column series and add values to it
Dim MyColumnSeries1 As New IndexedColumnSeries("Website A")
MyColumnSeries1.Values.Add(New Single() {5, 7, 9, 6})
Dim MyColumnSeries2 As New IndexedColumnSeries("Website B")
MyColumnSeries2.Values.Add(New Single() {4, 2, 5, 8})
Dim MyColumnSeries3 As New IndexedColumnSeries("Website C")
MyColumnSeries3.Values.Add(New Single() {2, 4, 6, 9})

' Add autogradient colors to series
Dim MyAutogradient1 As AutoGradient = New AutoGradient(90.0F, CmykColor.Red, CmykColor.IndianRed)
MyColumnSeries1.Color = MyAutogradient1
Dim MyAutogradient2 As AutoGradient = New AutoGradient(90.0F, CmykColor.Green, CmykColor.YellowGreen)
MyColumnSeries2.Color = MyAutogradient2
Dim MyAutogradient3 As AutoGradient = New AutoGradient(120.0F, CmykColor.Blue, CmykColor.LightBlue)
MyColumnSeries3.Color = MyAutogradient3

' Add indexed column series to the plot area
MyPlotArea.Series.Add(MyColumnSeries1)
MyPlotArea.Series.Add(MyColumnSeries2)
MyPlotArea.Series.Add(MyColumnSeries3)

' Create a title and add it to the yaxis
Dim MylTitle As New Title("Visitors (in millions)")
MyColumnSeries1.YAxis.Titles.Add(MylTitle)

'Adding AxisLabels to the XAxis
MyColumnSeries1.XAxis.Labels.Add(New IndexedXAxisLabel("Q1", 0))
MyColumnSeries1.XAxis.Labels.Add(New IndexedXAxisLabel("Q2", 1))
MyColumnSeries1.XAxis.Labels.Add(New IndexedXAxisLabel("Q3", 2))
MyColumnSeries1.XAxis.Labels.Add(New IndexedXAxisLabel("Q4", 3))

' Add the MyChart to the MyPage
MyPage.Elements.Add(MyChart)
' Save the PDF
MyDocument.Draw(pdfFilePath)
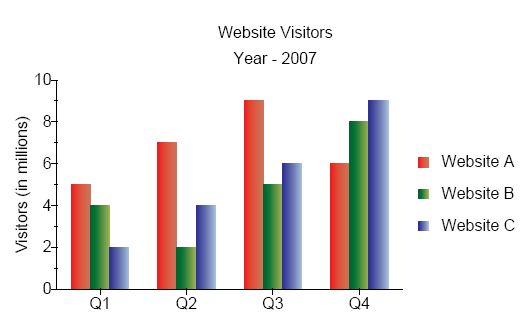
Figure 1. Normal Column Chart
Date/Time
The following example illustrates a column chart with data/time data.
// Create a PDF Document
Document document = new Document();

// Create a Page and add it to the document
Page page = new Page();
document.Pages.Add(page);

// Create a chart
Chart chart = new Chart(0, 0, 400, 200);

// Get the default plot area from the chart
PlotArea plotArea = chart.PrimaryPlotArea;

// Create header titles and add it to the chart
Title title1 = new Title("Website Visitors");
Title title2 = new Title("Year - 2007");
chart.HeaderTitles.Add(title1);
chart.HeaderTitles.Add(title2);

// Create a date time  column series element and add values to it
DateTimeColumnSeries seriesElement1 = new DateTimeColumnSeries("Website A");
seriesElement1.Values.Add(5, new DateTime(2007, 1, 1));
seriesElement1.Values.Add(7, new DateTime(2007, 2, 1));
seriesElement1.Values.Add(9, new DateTime(2007, 3, 1));
seriesElement1.Values.Add(6, new DateTime(2007, 4, 1));
DateTimeColumnSeries seriesElement2 = new DateTimeColumnSeries("Website B");
seriesElement2.Values.Add(4, new DateTime(2007, 1, 1));
seriesElement2.Values.Add(2, new DateTime(2007, 2, 1));
seriesElement2.Values.Add(5, new DateTime(2007, 3, 1));
seriesElement2.Values.Add(8, new DateTime(2007, 4, 1));
DateTimeColumnSeries seriesElement3 = new DateTimeColumnSeries("Website C");
seriesElement3.Values.Add(2, new DateTime(2007, 1, 1));
seriesElement3.Values.Add(4, new DateTime(2007, 2, 1));
seriesElement3.Values.Add(6, new DateTime(2007, 3, 1));
seriesElement3.Values.Add(9, new DateTime(2007, 4, 1));

// Add date time  column series to plot area
plotArea.Series.Add(seriesElement1);
plotArea.Series.Add(seriesElement2);
plotArea.Series.Add(seriesElement3);

// Create a title and add it to the yAxis
Title title3 = new Title("Viewers (in millions)");
seriesElement1.YAxis.Titles.Add(title3);

// set label  format for the axis labels
seriesElement1.XAxis.LabelFormat = "MMM";

// Add the chart to the page
page.Elements.Add(chart);

// Save the PDF
document.Draw(outputPath);
' Create a PDF Document
Dim MyDocument As Document = New Document()

' Create a Page and add it to the document
Dim MyPage As Page = New Page()
MyDocument.Pages.Add(MyPage)

' Create a chart
Dim MyChart As Chart = New Chart(0, 0, 400, 200)

' Get the default plot area from the chart
Dim MyPlotArea As PlotArea = MyChart.PrimaryPlotArea

' Create header titles and add it to the chart
Dim MyTitle1 As Title = New Title("Website Visitors")
Dim MyTitle2 As Title = New Title("Year - 2007")
MyChart.HeaderTitles.Add(MyTitle1)
MyChart.HeaderTitles.Add(MyTitle2)

' Create a date time column series and add values to it
Dim MyColumnSeries1 As DateTimeColumnSeries = New DateTimeColumnSeries("Website A")
MyColumnSeries1.Values.Add(5, New DateTime(2007, 1, 1))
MyColumnSeries1.Values.Add(7, New DateTime(2007, 2, 1))
MyColumnSeries1.Values.Add(4, New DateTime(2007, 3, 1))
MyColumnSeries1.Values.Add(3, New DateTime(2007, 4, 1))
Dim MyColumnSeries2 As DateTimeColumnSeries = New DateTimeColumnSeries("Website B")
MyColumnSeries2.Values.Add(4, New DateTime(2007, 1, 1))
MyColumnSeries2.Values.Add(2, New DateTime(2007, 2, 1))
MyColumnSeries2.Values.Add(5, New DateTime(2007, 3, 1))
MyColumnSeries2.Values.Add(8, New DateTime(2007, 4, 1))
Dim MyColumnSeries3 As DateTimeColumnSeries = New DateTimeColumnSeries("Website C")
MyColumnSeries3.Values.Add(2, New DateTime(2007, 1, 1))
MyColumnSeries3.Values.Add(4, New DateTime(2007, 2, 1))
MyColumnSeries3.Values.Add(6, New DateTime(2007, 3, 1))
MyColumnSeries3.Values.Add(9, New DateTime(2007, 4, 1))

' Add date time column series to the plot area
MyPlotArea.Series.Add(MyColumnSeries1)
MyPlotArea.Series.Add(MyColumnSeries2)
MyPlotArea.Series.Add(MyColumnSeries3)

' Create a title and add it to the yAxis
Dim MyTitle3 As Title = New Title("Viewers (in millions)")
MyColumnSeries1.YAxis.Titles.Add(MyTitle3)

' set label  format for the axis labels
MyColumnSeries1.XAxis.LabelFormat = "MMM"

' Add the chart to the page
MyPage.Elements.Add(MyChart)

' Save the PDF
MyDocument.Draw("C:\MyDocument.pdf")
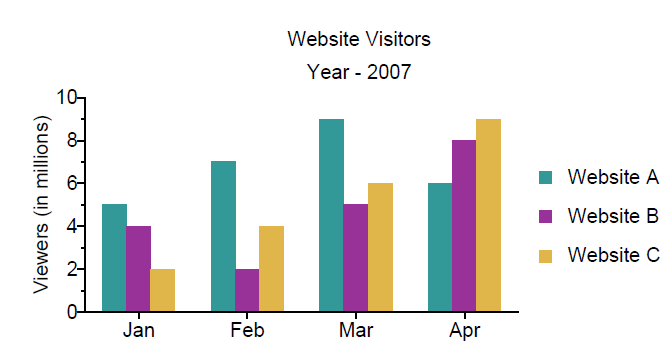 Figure 2. Column chart using date/time data.
Stacked
Stacked charts show related data, one on top of the other. They use DateTimeXAxis or IndexedXAxis as the XAxis based on the series and NumericYAxis as the YAxis.
Indexed
The following example illustrates a stacked column chart with indexed data.
// Create a PDF Document
Document document = new Document();
// Create a Page and add it to the document
Page page = new Page();
document.Pages.Add(page);

// Create a chart
Chart chart = new Chart(0, 0, 400, 230);
// Create a plot area
PlotArea plotArea = chart.PrimaryPlotArea;

// Create header titles and add it to the chart
Title title1 = new Title("Website Visitors");
Title title2 = new Title("Year - 2007");
chart.HeaderTitles.Add(title1);
chart.HeaderTitles.Add(title2);

// Create a indexed stacked column series elements and add values to it
IndexedStackedColumnSeriesElement seriesElement1 = new IndexedStackedColumnSeriesElement("Website A");
seriesElement1.Values.Add(new float[] { 5, 7, 9, 6 });
IndexedStackedColumnSeriesElement seriesElement2 = new IndexedStackedColumnSeriesElement("Website B");
seriesElement2.Values.Add(new float[] { 4, 2, 5, 8 });
IndexedStackedColumnSeriesElement seriesElement3 = new IndexedStackedColumnSeriesElement("Website C");
seriesElement3.Values.Add(new float[] { 2, 4, 6, 9 });

// Create autogradient and assign it to series
AutoGradient autogradient1 = new AutoGradient(180f, CmykColor.Red, CmykColor.IndianRed);
seriesElement1.Color = autogradient1;
AutoGradient autogradient2 = new AutoGradient(180f, CmykColor.Green, CmykColor.YellowGreen);
seriesElement2.Color = autogradient2;
AutoGradient autogradient3 = new AutoGradient(180f, CmykColor.Blue, CmykColor.LightBlue);
seriesElement3.Color = autogradient3;

// Create a Indexed Stacked Column Series
IndexedStackedColumnSeries columnSeries = new IndexedStackedColumnSeries();
// Add indexed stacked column series elements to the Indexed Stacked Column Series
columnSeries.Add(seriesElement1);
columnSeries.Add(seriesElement2);
columnSeries.Add(seriesElement3);
// Add series to the plot area
plotArea.Series.Add(columnSeries);

// Create a title and add it to the yaxis
Title lTitle = new Title("Visitors (in millions)");
columnSeries.YAxis.Titles.Add(lTitle);

//Adding AxisLabels to the XAxis
columnSeries.XAxis.Labels.Add(new IndexedXAxisLabel("Q1", 0));
columnSeries.XAxis.Labels.Add(new IndexedXAxisLabel("Q2", 1));
columnSeries.XAxis.Labels.Add(new IndexedXAxisLabel("Q3", 2));
columnSeries.XAxis.Labels.Add(new IndexedXAxisLabel("Q4", 3));

// Add the chart to the page
page.Elements.Add(chart);
// Save the PDF
document.Draw(pdfFilePath);
' Create a PDF Document
Dim MyDocument As New Document()
' Create a Page and add it to the MyDocument
Dim MyPage As New Page()
MyDocument.Pages.Add(MyPage)

' Create a MyChart
Dim MyChart As New Chart(0, 0, 400, 230)
' Create a plot area
Dim MyPlotArea As PlotArea = MyChart.PrimaryPlotArea

' Create header titles and add it to the MyChart
Dim MyTitle1 As New Title("Website Visitors")
Dim MyTitle2 As New Title("Year - 2007")
MyChart.HeaderTitles.Add(MyTitle1)
MyChart.HeaderTitles.Add(MyTitle2)

' Create a indexed stacked column series elements and add values to it
Dim MySeriesElement1 As New IndexedStackedColumnSeriesElement("Website A")
MySeriesElement1.Values.Add(New Single() {5, 7, 9, 6})
Dim MySeriesElement2 As New IndexedStackedColumnSeriesElement("Website B")
MySeriesElement2.Values.Add(New Single() {4, 2, 5, 8})
Dim MySeriesElement3 As New IndexedStackedColumnSeriesElement("Website C")
MySeriesElement3.Values.Add(New Single() {2, 4, 6, 9})

' Add autogradient colors to series
Dim MyAutogradient1 As AutoGradient = New AutoGradient(90.0F, CmykColor.Red, CmykColor.IndianRed)
MySeriesElement1.Color = MyAutogradient1
Dim MyAutogradient2 As AutoGradient = New AutoGradient(90.0F, CmykColor.Green, CmykColor.YellowGreen)
MySeriesElement2.Color = MyAutogradient2
Dim MyAutogradient3 As AutoGradient = New AutoGradient(120.0F, CmykColor.Blue, CmykColor.LightBlue)
MySeriesElement3.Color = MyAutogradient3

' Create a Indexed Stacked Column Series
Dim MyColumnSeries As New IndexedStackedColumnSeries()
' Add indexed stacked column series elements to the Indexed Stacked Column Series
MyColumnSeries.Add(MySeriesElement1)
MyColumnSeries.Add(MySeriesElement2)
MyColumnSeries.Add(MySeriesElement3)
' Add series to the plot area
MyPlotArea.Series.Add(MyColumnSeries)

'Create a title and add it to the yaxis
Dim MylTitle As New Title("Visitors (in millions)")
MyColumnSeries.YAxis.Titles.Add(MylTitle)

'Adding AxisLabels to the XAxis
MyColumnSeries.XAxis.Labels.Add(New IndexedXAxisLabel("Q1", 0))
MyColumnSeries.XAxis.Labels.Add(New IndexedXAxisLabel("Q2", 1))
MyColumnSeries.XAxis.Labels.Add(New IndexedXAxisLabel("Q3", 2))
MyColumnSeries.XAxis.Labels.Add(New IndexedXAxisLabel("Q4", 3))

' Add the MyChart to the MyPage
MyPage.Elements.Add(MyChart)
' Save the PDF
MyDocument.Draw(pdfFilePath)
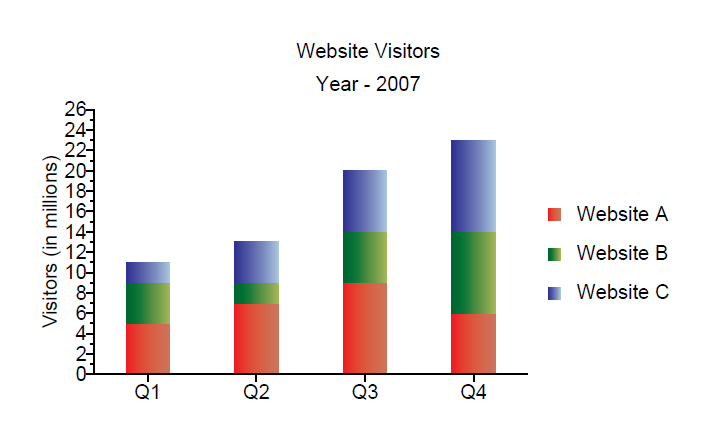 Figure 3. Column stacked chart using indexed data.
Date/Time
The following example illustrates a stacked column data using date/time data.
// Create a PDF Document
Document document = new Document();

// Create a Page and add it to the document
Page page = new Page();
document.Pages.Add(page);

// Create a chart
Chart chart = new Chart(0, 0, 400, 200);

//Get the default plot area from the chart
PlotArea plotArea = chart.PrimaryPlotArea;

// Create header titles and add it to the chart
Title title1 = new Title("Website Visitors");
Title title2 = new Title("Year - 2007");
chart.HeaderTitles.Add(title1);
chart.HeaderTitles.Add(title2);

// Create a date time stacked column series element and add values to it
DateTimeStackedColumnSeriesElement seriesElement1 = new DateTimeStackedColumnSeriesElement("Website A");
seriesElement1.Values.Add(5, new DateTime(2007, 1, 1));
seriesElement1.Values.Add(7, new DateTime(2007, 2, 1));
seriesElement1.Values.Add(9, new DateTime(2007, 3, 1));
seriesElement1.Values.Add(6, new DateTime(2007, 4, 1));
DateTimeStackedColumnSeriesElement seriesElement2 = new DateTimeStackedColumnSeriesElement("Website B");
seriesElement2.Values.Add(4, new DateTime(2007, 1, 1));
seriesElement2.Values.Add(2, new DateTime(2007, 2, 1));
seriesElement2.Values.Add(5, new DateTime(2007, 3, 1));
seriesElement2.Values.Add(8, new DateTime(2007, 4, 1));
DateTimeStackedColumnSeriesElement seriesElement3 = new DateTimeStackedColumnSeriesElement("Website C");
seriesElement3.Values.Add(2, new DateTime(2007, 1, 1));
seriesElement3.Values.Add(4, new DateTime(2007, 2, 1));
seriesElement3.Values.Add(6, new DateTime(2007, 3, 1));
seriesElement3.Values.Add(9, new DateTime(2007, 4, 1));

// Create a date time stacked column series and add date time stacked column series elements to it
DateTimeStackedColumnSeries stackedColumnSeries1 = new DateTimeStackedColumnSeries();
stackedColumnSeries1.Add(seriesElement1);
stackedColumnSeries1.Add(seriesElement2);
stackedColumnSeries1.Add(seriesElement3);

// Add date time stacked column series to plot area
plotArea.Series.Add(stackedColumnSeries1);

// Create a title and add it to the yAxis
Title title3 = new Title("Viewers (in millions)");
stackedColumnSeries1.YAxis.Titles.Add(title3);

// set label  format for the axis labels
stackedColumnSeries1.XAxis.LabelFormat = "MMM";

// Add the chart to the page
page.Elements.Add(chart);

// Save the PDF
document.Draw(outputPath);
' Create a PDF Document
Dim MyDocument As Document = New Document()

' Create a Page and add it to the document
Dim MyPage As Page = New Page()
MyDocument.Pages.Add(MyPage)

' Create a chart
Dim MyChart As Chart = New Chart(0, 0, 400, 200)

' Get the default plot area from the chart
Dim MyPlotArea As PlotArea = MyChart.PrimaryPlotArea

' Create header titles and add it to the chart
Dim MyTitle1 As Title = New Title("Website Visitors")
Dim MyTitle2 As Title = New Title("Year - 2007")
MyChart.HeaderTitles.Add(MyTitle1)
MyChart.HeaderTitles.Add(MyTitle2)

' Create a date time stacked column series element and add values to it
Dim MySeriesElement1 As DateTimeStackedColumnSeriesElement = New DateTimeStackedColumnSeriesElement("Website A")
MySeriesElement1.Values.Add(5, New DateTime(2007, 1, 1))
MySeriesElement1.Values.Add(7, New DateTime(2007, 2, 1))
MySeriesElement1.Values.Add(9, New DateTime(2007, 3, 1))
MySeriesElement1.Values.Add(6, New DateTime(2007, 4, 1))
Dim MySeriesElement2 As DateTimeStackedColumnSeriesElement = New DateTimeStackedColumnSeriesElement("Website B")
MySeriesElement2.Values.Add(4, New DateTime(2007, 1, 1))
MySeriesElement2.Values.Add(2, New DateTime(2007, 2, 1))
MySeriesElement2.Values.Add(5, New DateTime(2007, 3, 1))
MySeriesElement2.Values.Add(8, New DateTime(2007, 4, 1))
Dim MySeriesElement3 As DateTimeStackedColumnSeriesElement = New DateTimeStackedColumnSeriesElement("Website C")
MySeriesElement3.Values.Add(2, New DateTime(2007, 1, 1))
MySeriesElement3.Values.Add(4, New DateTime(2007, 2, 1))
MySeriesElement3.Values.Add(6, New DateTime(2007, 3, 1))
MySeriesElement3.Values.Add(9, New DateTime(2007, 4, 1))

' Create a date time stacked column series and add date time stacked column series elements to it
Dim MyStackedColumnSeries1 As DateTimeStackedColumnSeries = New DateTimeStackedColumnSeries()
MyStackedColumnSeries1.Add(MySeriesElement1)
MyStackedColumnSeries1.Add(MySeriesElement2)
MyStackedColumnSeries1.Add(MySeriesElement3)

' Add date time stacked column series to plot area
MyPlotArea.Series.Add(MyStackedColumnSeries1)

' Create a title and add it to the yAxis
Dim MyTitle3 As Title = New Title("Viewers (in millions)")
MyStackedColumnSeries1.YAxis.Titles.Add(MyTitle3)

' set label  format for the axis labels
MyStackedColumnSeries1.XAxis.LabelFormat = "MMM"

' Add the chart to the page
MyPage.Elements.Add(MyChart)

' Save the PDF
MyDocument.Draw("C:\MyDocument.pdf")
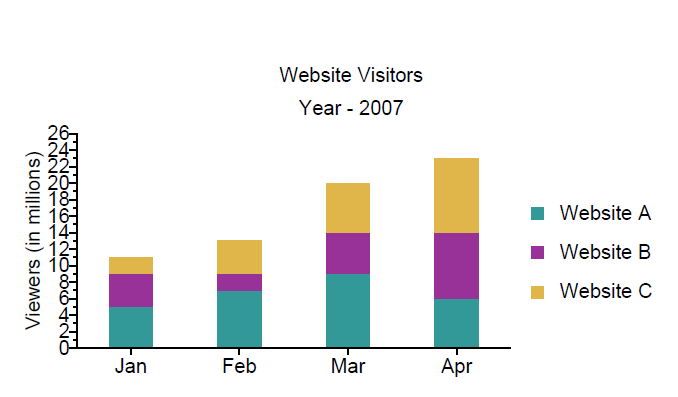 Figure 4. Column stacked chart using date/time data.
100% Stacked
100% stacked charts are similar to stacked charts, but here the data is expressed as a percentage. They use DateTimeXAxis or IndexedXAxis as the XAxis based on the series and PercentageYAxis as the YAxis.
Indexed
The following example illustrates a stacked 100% column chart using indexed data.
// Create a PDF Document
Document document = new Document();
// Create a Page and add it to the document
Page page = new Page();
document.Pages.Add(page);

// Create a chart
Chart chart = new Chart(0, 0, 400, 230);
// Create a plot area
PlotArea plotArea = chart.PrimaryPlotArea;

// Create header titles and add it to the chart
Title title1 = new Title("Website Visitors");
Title title2 = new Title("Year - 2007");
chart.HeaderTitles.Add(title1);
chart.HeaderTitles.Add(title2);

// Create a indexed 100% column series elements and add values to it
Indexed100PercentStackedColumnSeriesElement seriesElement1 = new Indexed100PercentStackedColumnSeriesElement("Website A");
seriesElement1.Values.Add(new float[] { 5, 7, 9, 6 });
Indexed100PercentStackedColumnSeriesElement seriesElement2 = new Indexed100PercentStackedColumnSeriesElement("Website B");
seriesElement2.Values.Add(new float[] { 4, 2, 5, 8 });
Indexed100PercentStackedColumnSeriesElement seriesElement3 = new Indexed100PercentStackedColumnSeriesElement("Website C");
seriesElement3.Values.Add(new float[] { 2, 4, 6, 9 });

// Create autogradient and assign it to series
AutoGradient autogradient1 = new AutoGradient(180f, CmykColor.Red, CmykColor.IndianRed);
seriesElement1.Color = autogradient1;
AutoGradient autogradient2 = new AutoGradient(180f, CmykColor.Green, CmykColor.YellowGreen);
seriesElement2.Color = autogradient2;
AutoGradient autogradient3 = new AutoGradient(180f, CmykColor.Blue, CmykColor.LightBlue);
seriesElement3.Color = autogradient3;

// Create a Indexed 100% Stacked Column Series
Indexed100PercentStackedColumnSeries columnSeries = new Indexed100PercentStackedColumnSeries();
// Add indexed 100% column series elements to the Indexed 100% Stacked Column Series
columnSeries.Add(seriesElement1);
columnSeries.Add(seriesElement2);
columnSeries.Add(seriesElement3);
// Add series to the plot area
plotArea.Series.Add(columnSeries);

// Create a title and add it to the yaxis
Title lTitle = new Title("Visitors (in millions)");
columnSeries.YAxis.Titles.Add(lTitle);

//Adding AxisLabels to the XAxis
columnSeries.XAxis.Labels.Add(new IndexedXAxisLabel("Q1", 0));
columnSeries.XAxis.Labels.Add(new IndexedXAxisLabel("Q2", 1));
columnSeries.XAxis.Labels.Add(new IndexedXAxisLabel("Q3", 2));
columnSeries.XAxis.Labels.Add(new IndexedXAxisLabel("Q4", 3));

// Add the chart to the page
page.Elements.Add(chart);
// Save the PDF
document.Draw(pdfFilePath);
' Create a PDF Document
Dim MyDocument As New Document()
' Create a Page and add it to the MyDocument
Dim MyPage As New Page()
MyDocument.Pages.Add(MyPage)

' Create a MyChart
Dim MyChart As New Chart(0, 0, 400, 230)

' Create a plot area
Dim MyPlotArea As PlotArea = MyChart.PrimaryPlotArea

' Create header titles and add it to the MyChart
Dim MyTitle1 As New Title("Website Visitors")
Dim MyTitle2 As New Title("Year - 2007")
MyChart.HeaderTitles.Add(MyTitle1)
MyChart.HeaderTitles.Add(MyTitle2)

' Create a indexed 100% column series elements and add values to it
Dim MySeriesElement1 As New Indexed100PercentStackedColumnSeriesElement("Website A")
MySeriesElement1.Values.Add(New Single() {5, 7, 9, 6})
Dim MySeriesElement2 As New Indexed100PercentStackedColumnSeriesElement("Website B")
MySeriesElement2.Values.Add(New Single() {4, 2, 5, 8})
Dim MySeriesElement3 As New Indexed100PercentStackedColumnSeriesElement("Website C")
MySeriesElement3.Values.Add(New Single() {2, 4, 6, 9})

' Add autogradient colors to series
Dim MyAutogradient1 As AutoGradient = New AutoGradient(90.0F, CmykColor.Red, CmykColor.IndianRed)
MySeriesElement1.Color = MyAutogradient1
Dim MyAutogradient2 As AutoGradient = New AutoGradient(90.0F, CmykColor.Green, CmykColor.YellowGreen)
MySeriesElement2.Color = MyAutogradient2
Dim MyAutogradient3 As AutoGradient = New AutoGradient(120.0F, CmykColor.Blue, CmykColor.LightBlue)
MySeriesElement3.Color = MyAutogradient3

' Create a Indexed 100% Stacked Column Series
Dim MyColumnSeries As New Indexed100PercentStackedColumnSeries()

'Add indexed 100% column series elements to the Indexed 100% Stacked Column Series
MyColumnSeries.Add(MySeriesElement1)
MyColumnSeries.Add(MySeriesElement2)
MyColumnSeries.Add(MySeriesElement3)

' Add series to the plot area
MyPlotArea.Series.Add(MyColumnSeries)

' Create a title and add it to the yaxis
Dim MylTitle As New Title("Visitors (in millions)")
MyColumnSeries.YAxis.Titles.Add(MylTitle)

'Adding AxisLabels to the XAxis
MyColumnSeries.XAxis.Labels.Add(New IndexedXAxisLabel("Q1", 0))
MyColumnSeries.XAxis.Labels.Add(New IndexedXAxisLabel("Q2", 1))
MyColumnSeries.XAxis.Labels.Add(New IndexedXAxisLabel("Q3", 2))
MyColumnSeries.XAxis.Labels.Add(New IndexedXAxisLabel("Q4", 3))

' Add the MyChart to the MyPage
MyPage.Elements.Add(MyChart)

' Save the PDF
MyDocument.Draw(pdfFilePath)
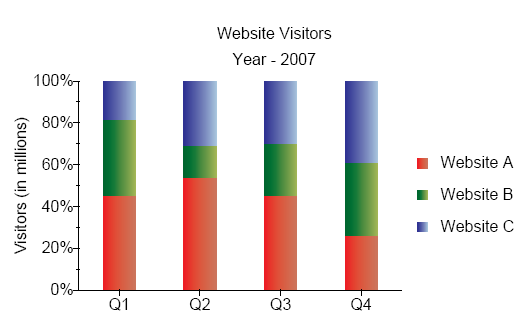
Figure 5. Stacked 100% Column Chart
Date/Time
The following example illustrates a stacked 100% column chart using date/time data.
// Create a PDF Document
Document document = new Document();

// Create a Page and add it to the document
Page page = new Page();
document.Pages.Add(page);

// Create a chart
Chart chart = new Chart(0, 0, 400, 200);

//Get the default plot area from the chart
PlotArea plotArea = chart.PrimaryPlotArea;

// Create header titles and add it to the chart
Title title1 = new Title("Website Visitors");
Title title2 = new Title("Year - 2007");
chart.HeaderTitles.Add(title1);
chart.HeaderTitles.Add(title2);

// Create a date time 100 percent stacked column series elements and add values to it
DateTime100PercentStackedColumnSeriesElement seriesElement1 = new DateTime100PercentStackedColumnSeriesElement("Website A");
seriesElement1.Values.Add(5, new DateTime(2007, 1, 1));
seriesElement1.Values.Add(7, new DateTime(2007, 2, 1));
seriesElement1.Values.Add(4, new DateTime(2007, 3, 1));
seriesElement1.Values.Add(3, new DateTime(2007, 4, 1));
DateTime100PercentStackedColumnSeriesElement seriesElement2 = new DateTime100PercentStackedColumnSeriesElement("Website B");
seriesElement2.Values.Add(4, new DateTime(2007, 1, 1));
seriesElement2.Values.Add(2, new DateTime(2007, 2, 1));
seriesElement2.Values.Add(5, new DateTime(2007, 3, 1));
seriesElement2.Values.Add(8, new DateTime(2007, 4, 1));
DateTime100PercentStackedColumnSeriesElement seriesElement3 = new DateTime100PercentStackedColumnSeriesElement("Website C");
seriesElement3.Values.Add(2, new DateTime(2007, 1, 1));
seriesElement3.Values.Add(4, new DateTime(2007, 2, 1));
seriesElement3.Values.Add(6, new DateTime(2007, 3, 1));
seriesElement3.Values.Add(9, new DateTime(2007, 4, 1));

// Create a date time 100 percent stacked column series and add date time 100 percent stacked column series elements to it
DateTime100PercentStackedColumnSeries stackedColumnSeries1 = new DateTime100PercentStackedColumnSeries();
stackedColumnSeries1.Add(seriesElement1);
stackedColumnSeries1.Add(seriesElement2);
stackedColumnSeries1.Add(seriesElement3);

// Add date time 100 percent stacked column series to plot area
plotArea.Series.Add(stackedColumnSeries1);

// set label  format for the axis labels
stackedColumnSeries1.XAxis.LabelFormat = "MMM";

// Add the chart to the page
page.Elements.Add(chart);

// Save the PDF
document.Draw(outputPath);
' Create a PDF Document
Dim MyDocument As Document = New Document()

' Create a Page and add it to the document
Dim MyPage As Page = New Page()
MyDocument.Pages.Add(MyPage)

' Create a chart
Dim MyChart As Chart = New Chart(0, 0, 400, 200)

'Get the default plot area from the chart
Dim MyPlotArea As PlotArea = MyChart.PrimaryPlotArea

' Create header titles and add it to the chart
Dim MyTitle1 As Title = New Title("Website Visitors")
Dim MyTitle2 As Title = New Title("Year - 2007")
MyChart.HeaderTitles.Add(MyTitle1)
MyChart.HeaderTitles.Add(MyTitle2)

' Create a date time 100 percent stacked column series elements and add values to it
Dim MySeriesElement1 As DateTime100PercentStackedColumnSeriesElement = New DateTime100PercentStackedColumnSeriesElement("Website A")
MySeriesElement1.Values.Add(5, New DateTime(2007, 1, 1))
MySeriesElement1.Values.Add(7, New DateTime(2007, 2, 1))
MySeriesElement1.Values.Add(4, New DateTime(2007, 3, 1))
MySeriesElement1.Values.Add(3, New DateTime(2007, 4, 1))
Dim MySeriesElement2 As DateTime100PercentStackedColumnSeriesElement = New DateTime100PercentStackedColumnSeriesElement("Website B")
MySeriesElement2.Values.Add(4, New DateTime(2007, 1, 1))
MySeriesElement2.Values.Add(2, New DateTime(2007, 2, 1))
MySeriesElement2.Values.Add(5, New DateTime(2007, 3, 1))
MySeriesElement2.Values.Add(8, New DateTime(2007, 4, 1))
Dim MySeriesElement3 As DateTime100PercentStackedColumnSeriesElement = New DateTime100PercentStackedColumnSeriesElement("Website C")
MySeriesElement3.Values.Add(2, New DateTime(2007, 1, 1))
MySeriesElement3.Values.Add(4, New DateTime(2007, 2, 1))
MySeriesElement3.Values.Add(6, New DateTime(2007, 3, 1))
MySeriesElement3.Values.Add(9, New DateTime(2007, 4, 1))

' Create a date time 100 percent stacked column series and add date time 100 percent stacked column series elements to it
Dim MyStackedColumnSeries1 As DateTime100PercentStackedColumnSeries = New DateTime100PercentStackedColumnSeries()
MyStackedColumnSeries1.Add(MySeriesElement1)
MyStackedColumnSeries1.Add(MySeriesElement2)
MyStackedColumnSeries1.Add(MySeriesElement3)

' Add date time 100 percent stacked column series to plot area
MyPlotArea.Series.Add(MyStackedColumnSeries1)

' set label  format for the axis labels
MyStackedColumnSeries1.XAxis.LabelFormat = "MMM"

' Add the chart to the page
MyPage.Elements.Add(MyChart)

' Save the PDF
MyDocument.Draw(outputPath)
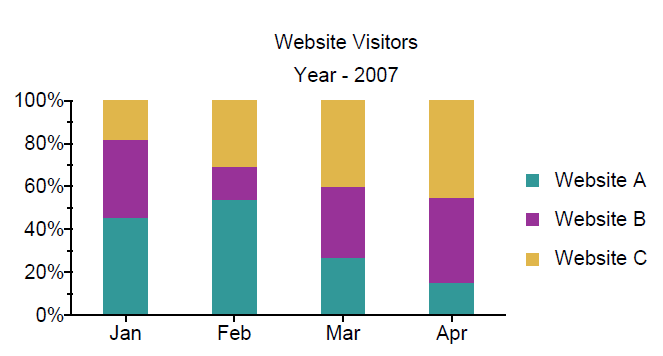 Figure 6. Column 100% stacked chart using date/time data.