Line Chart
A line chart displays information as a series of data points connected by straight line segments. There are three different types of line charts offered by Core Suite for creating line charts: normal, stacked, and 100% Stacked.
- Normal line charts describe the data as line segments.
- Stacked charts show lines of related data, one on top of the other.
- 100% stacked charts are similar to stacked charts, but express its data as percentages.
Line Series
The LineSeries, StackedLineSeries, and Stacked100PercentLineSeries abstract classes are the parent classes for line charts depending upon if the data is stacked or not. As these classes are abstract, you must create one of the following concrete classes implementing a line series.
- IndexedLineSeries
- IndexedStackedLineSeries
- Indexed100PercentStackedLineSeries
- DateTimeLineSeries
- DateTimeStackedLineSeries
- DateTime100PercentStackedLineSeries
Indexed
When creating a line chart with index data, use the IndexedLineSeries, IndexedStackedLineSeries, or Indexed100PercentStackedLineSeries classes.
Date/Time
When creating a line chart with date/time data, use the DateTimeLineSeries, DateTimeStackedLineSeries, or DateTime100PercentStackedLineSeries classes.
Normal
Normal Line charts create lines based on the data. They use DateTimeXAxis or IndexedXAxis as the XAxis based on the series and NumericYAxis as the YAxis.
Indexed
The following example illustrates creating a line chart with indexed data. As the example illustrates, to create the line series your perform the following steps.
- Create an IndexedLineSeries instance
- Add the values to the series instance using the Add method.
- Repeat for as many data series as relevant.
- Add all the line series instances to the plot area.
- Add the y-axis title.
- Add the x-axis labels for each series.
// Create a PDF Document
Document document = new Document();
// Create a Page and add it to the document
Page page = new Page();
document.Pages.Add(page);

// Create a chart
Chart chart = new Chart(0, 0, 400, 230);
// Create a plot area
PlotArea plotArea = chart.PrimaryPlotArea;

// Create header titles and add it to the chart
Title title1 = new Title("Website Visitors");
Title title2 = new Title("Year - 2007");
chart.HeaderTitles.Add(title1);
chart.HeaderTitles.Add(title2);

// Create a indexed line series and add values to it
IndexedLineSeries lineSeries1 = new IndexedLineSeries("Website A");
lineSeries1.Values.Add(new float[] { 5, 7, 9, 6 });
IndexedLineSeries lineSeries2 = new IndexedLineSeries("Website B");
lineSeries2.Values.Add(new float[] { 4, 2, 5, 8 });
IndexedLineSeries lineSeries3 = new IndexedLineSeries("Website C");
lineSeries3.Values.Add(new float[] { 2, 4, 6, 9 });

// Add indexed line series to the plot area
plotArea.Series.Add(lineSeries1);
plotArea.Series.Add(lineSeries2);
plotArea.Series.Add(lineSeries3);

// Create a title and add it to the yaxis
Title lTitle = new Title("Visitors (in millions)");
lineSeries1.YAxis.Titles.Add(lTitle);

//Adding AxisLabels to the XAxis
lineSeries1.XAxis.Labels.Add(new IndexedXAxisLabel("Q1", 0));
lineSeries1.XAxis.Labels.Add(new IndexedXAxisLabel("Q2", 1));
lineSeries1.XAxis.Labels.Add(new IndexedXAxisLabel("Q3", 2));
lineSeries1.XAxis.Labels.Add(new IndexedXAxisLabel("Q4", 3));

// Add the chart to the page
page.Elements.Add(chart);
// Save the PDF
document.Draw(pdfFilePath);
' Create a PDF Document
Dim MyDocument As New Document()

' Create a Page and add it to the MyDocument
Dim MyPage As New Page()
MyDocument.Pages.Add(MyPage)

' Create a MyChart
Dim MyChart As New Chart(0, 0, 400, 230)

' Create a plot area
Dim MyPlotArea As PlotArea = MyChart.PrimaryPlotArea

' Create header titles and add it to the MyChart
Dim MyTitle1 As New Title("Website Visitors")
Dim MyTitle2 As New Title("Year - 2007")
MyChart.HeaderTitles.Add(MyTitle1)
MyChart.HeaderTitles.Add(MyTitle2)

' Create a indexed line series and add values to it
Dim MyLineSeries1 As New IndexedLineSeries("Website A")
MyLineSeries1.Values.Add(New Single() {5, 7, 9, 6})
Dim MyLineSeries2 As New IndexedLineSeries("Website B")
MyLineSeries2.Values.Add(New Single() {4, 2, 5, 8})
Dim MyLineSeries3 As New IndexedLineSeries("Website C")
MyLineSeries3.Values.Add(New Single() {2, 4, 6, 9})

' Add indexed line series to the plot area
MyPlotArea.Series.Add(MyLineSeries1)
MyPlotArea.Series.Add(MyLineSeries2)
MyPlotArea.Series.Add(MyLineSeries3)

' Create a title and add it to the yaxis
Dim MylTitle As New Title("Visitors (in millions)")
MyLineSeries1.YAxis.Titles.Add(MylTitle)

'Adding AxisLabels to the XAxis
MyLineSeries1.XAxis.Labels.Add(New IndexedXAxisLabel("Q1", 0))
MyLineSeries1.XAxis.Labels.Add(New IndexedXAxisLabel("Q2", 1))
MyLineSeries1.XAxis.Labels.Add(New IndexedXAxisLabel("Q3", 2))
MyLineSeries1.XAxis.Labels.Add(New IndexedXAxisLabel("Q4", 3))

' Add the MyChart to the MyPage
MyPage.Elements.Add(MyChart)
' Save the PDF
MyDocument.Draw(pdfFilePath)
Figure 1. Normal indexed line chart
Date/Time
The following example illustrates adding a date/time series to a line chart. Perform the following steps to create the date/time chart.
Refer to Microsoft's documentation on date/time formats for more information on formatting date/time.
- Create the needed DateTime instances.
- Create a DateTimeLineSeries instance to hold the data.
- Add the values, where each value is associated with the relevant DateTime instance.
- Repeat for as many line series instances as needed.
- Add each created line series to the plot area.
- Specify the y-axis title.
- Specify the x-axis date/time format.
Document document = new Document();
Page page = new Page();
document.Pages.Add(page);
Chart chart = new Chart(0, 0, 400, 200);
PlotArea plotArea = chart.PrimaryPlotArea;
Title title1 = new Title("Website Visitors");
Title title2 = new Title("Year - 2007");
chart.HeaderTitles.Add(title1);
chart.HeaderTitles.Add(title2);

DateTime p0 = new DateTime(2007, 1, 1);
DateTime p1 = new DateTime(2007, 2, 1);
DateTime p2 = new DateTime(2007, 3, 1);
DateTime p3 = new DateTime(2007, 4, 1);

DateTimeLineSeries lineSeries1 = new DateTimeLineSeries("Website A");
lineSeries1.Values.Add(5, p0);
lineSeries1.Values.Add(7, p1);
lineSeries1.Values.Add(9, p2);
lineSeries1.Values.Add(6, p3);
DateTimeLineSeries lineSeries2 = new DateTimeLineSeries("Website B");
lineSeries2.Values.Add(4, p0);
lineSeries2.Values.Add(2, p1);
lineSeries2.Values.Add(5, p2);
lineSeries2.Values.Add(8, p3);
DateTimeLineSeries lineSeries3 = new DateTimeLineSeries("Website C");
lineSeries3.Values.Add(2, p0);
lineSeries3.Values.Add(4, p1);
lineSeries3.Values.Add(6, p2);
lineSeries3.Values.Add(9, p3);

plotArea.Series.Add(lineSeries1);
plotArea.Series.Add(lineSeries2);
plotArea.Series.Add(lineSeries3);

Title title3 = new Title("Viewers (in millions)");
lineSeries1.YAxis.Titles.Add(title3);
lineSeries1.XAxis.LabelFormat = "MMM";
page.Elements.Add(chart);
document.Draw(pdfFilePath);
' Create a PDF Document
Dim MyDocument As Document = New Document()

' Create a Page and add it to the document
Dim MyPage As Page = New Page()
MyDocument.Pages.Add(MyPage)

' Create a chart
Dim MyChart As Chart = New Chart(0, 0, 400, 200)

' Get the default plot area from the chart
Dim MyPlotArea As PlotArea = MyChart.PrimaryPlotArea

' Create header titles and add it to the chart
Dim MyTitle1 As Title = New Title("Website Visitors")
Dim MyTitle2 As Title = New Title("Year - 2007")
MyChart.HeaderTitles.Add(MyTitle1)
MyChart.HeaderTitles.Add(MyTitle2)

' Create positions
Dim p0 As DateTime = New DateTime(2007, 1, 1)
Dim p1 As DateTime = New DateTime(2007, 2, 1)
Dim p2 As DateTime = New DateTime(2007, 3, 1)
Dim p3 As DateTime = New DateTime(2007, 4, 1)

' Create a date time line series and add values to it
Dim MyLineSeries1 As DateTimeLineSeries = New DateTimeLineSeries("Website A")
MyLineSeries1.Values.Add(5, p0)
MyLineSeries1.Values.Add(7, p1)
MyLineSeries1.Values.Add(9, p2)
MyLineSeries1.Values.Add(6, p3)
Dim MyLineSeries2 As DateTimeLineSeries = New DateTimeLineSeries("Website B")
MyLineSeries2.Values.Add(4, p0)
MyLineSeries2.Values.Add(2, p1)
MyLineSeries2.Values.Add(5, p2)
MyLineSeries2.Values.Add(8, p3)
Dim MyLineSeries3 As DateTimeLineSeries = New DateTimeLineSeries("Website C")
MyLineSeries3.Values.Add(2, p0)
MyLineSeries3.Values.Add(4, p1)
MyLineSeries3.Values.Add(6, p2)
MyLineSeries3.Values.Add(9, p3)

' Add date time line series to the plot area
MyPlotArea.Series.Add(MyLineSeries1)
MyPlotArea.Series.Add(MyLineSeries2)
MyPlotArea.Series.Add(MyLineSeries3)

' Create a title and add it to the yAxis
Dim MyTitle3 As Title = New Title("Viewers (in millions)")
MyLineSeries1.YAxis.Titles.Add(MyTitle3)

' set label  format for the axis labels
MyLineSeries1.XAxis.LabelFormat = "MMM"

' Add the chart to the page
MyPage.Elements.Add(MyChart)

' Save the PDF
MyDocument.Draw("C:\MyDocument.pdf")
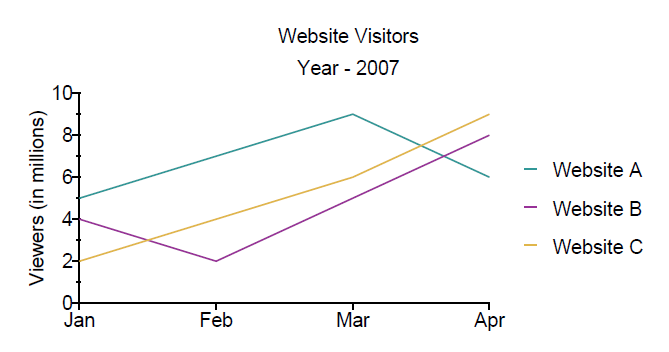
Figure 2. Normal date/time line chart
Stacked
Stacked charts show related data, one on top of the other. They use DateTimeXAxis or IndexedXAxis as the XAxis based on the series and NumericYAxis as the YAxis.
Indexed
The following example illustrates adding stacked indexed data to a chart. Peform the following steps to create the chart.
- Create a new IndexedStackedLineSeriesElement instance.
- Add the values to the instance.
- Repeat for as many line series needed.
- Create and IndexedStackedLineSeries instance and add the IndexedStackedLineSeriesElement instances to it.
- Add the IndexedStackLineSeries instance to the plot area.
- Add the y-axis title.
- Add the x-axis labels, where the labels are instances of the IndexedXAxisLabel class.
// Create a PDF Document
Document document = new Document();
// Create a Page and add it to the document
Page page = new Page();
document.Pages.Add(page);

// Create a chart
Chart chart = new Chart(0, 0, 400, 230);
// Create a plot area
PlotArea plotArea = chart.PrimaryPlotArea;

// Create header titles and add it to the chart
Title title1 = new Title("Website Visitors");
Title title2 = new Title("Year - 2007");
chart.HeaderTitles.Add(title1);
chart.HeaderTitles.Add(title2);

// Create a indexed stacked line series elements and add values to it
IndexedStackedLineSeriesElement seriesElement1 = new IndexedStackedLineSeriesElement("Website A");
seriesElement1.Values.Add(new float[] { 5, 7, 9, 6 });
IndexedStackedLineSeriesElement seriesElement2 = new IndexedStackedLineSeriesElement("Website B");
seriesElement2.Values.Add(new float[] { 4, 2, 5, 8 });
IndexedStackedLineSeriesElement seriesElement3 = new IndexedStackedLineSeriesElement("Website C");
seriesElement3.Values.Add(new float[] { 2, 4, 6, 9 });

// Create a Indexed Stacked Line Series
IndexedStackedLineSeries lineSeries = new IndexedStackedLineSeries();
// Add indexed stacked line series elements to the Indexed Stacked Line Series
lineSeries.Add(seriesElement1);
lineSeries.Add(seriesElement2);
lineSeries.Add(seriesElement3);

// Add the series to the plot area
plotArea.Series.Add(lineSeries);

// Create a title and add it to the yaxis
Title lTitle = new Title("Visitors (in millions)");
lineSeries.YAxis.Titles.Add(lTitle);

//Adding AxisLabels to the XAxis
lineSeries.XAxis.Labels.Add(new IndexedXAxisLabel("Q1", 0));
lineSeries.XAxis.Labels.Add(new IndexedXAxisLabel("Q2", 1));
lineSeries.XAxis.Labels.Add(new IndexedXAxisLabel("Q3", 2));
lineSeries.XAxis.Labels.Add(new IndexedXAxisLabel("Q4", 3));

// Add the chart to the page
page.Elements.Add(chart);
// Save the PDF
document.Draw(pdfFilePath);
' Create a PDF Document
Dim MyDocument As New Document()

' Create a Page and add it to the MyDocument
Dim MyPage = New Page()
MyDocument.Pages.Add(MyPage)

' Create a MyChart
Dim MyChart As New Chart(0, 0, 400, 230)

'Create a plot area
Dim MyPlotArea As PlotArea = MyChart.PrimaryPlotArea

' Create header titles and add it to the MyChart
Dim MyTitle1 As New Title("Website Visitors")
Dim MyTitle2 As New Title("Year - 2007")
MyChart.HeaderTitles.Add(MyTitle1)
MyChart.HeaderTitles.Add(MyTitle2)

' Create a indexed stacked line series elements and add values to it
Dim MySeriesElement1 As New IndexedStackedLineSeriesElement("Website A")
MySeriesElement1.Values.Add(New Single() {5, 7, 9, 6})
Dim MySeriesElement2 As New IndexedStackedLineSeriesElement("Website B")
MySeriesElement2.Values.Add(New Single() {4, 2, 5, 8})
Dim MySeriesElement3 As New IndexedStackedLineSeriesElement("Website C")
MySeriesElement3.Values.Add(New Single() {2, 4, 6, 9})

' Create a Indexed Stacked Line Series
Dim MylineSeries As New IndexedStackedLineSeries()

' Add indexed stacked line series elements to the Indexed Stacked Line Series
MylineSeries.Add(MySeriesElement1)
MylineSeries.Add(MySeriesElement2)
MylineSeries.Add(MySeriesElement3)

' Add the series to the plot area
MyPlotArea.Series.Add(MylineSeries)

' Create a title and add it to the yaxis
Dim MylTitle As New Title("Visitors (in millions)")
MylineSeries.YAxis.Titles.Add(MylTitle)

'Adding AxisLabels to the XAxis
MylineSeries.XAxis.Labels.Add(New IndexedXAxisLabel("Q1", 0))
MylineSeries.XAxis.Labels.Add(New IndexedXAxisLabel("Q2", 1))
MylineSeries.XAxis.Labels.Add(New IndexedXAxisLabel("Q3", 2))
MylineSeries.XAxis.Labels.Add(New IndexedXAxisLabel("Q4", 3))

' Add the MyChart to the MyPage
MyPage.Elements.Add(MyChart)
' Save the PDF
MyDocument.Draw(pdfFilePath)
Figure3. Stacked indexed line chart
Date/Time
The following example illustrates adding stacked date/time data to a chart. Perform the following steps to create the chart.
- Create a new DateTimeStackedLineSeriesElement instance.
- Add the values to the instance, where each value is the value and DateTime needed.
- Repeat for as many element instances as needed.
- Create a new DateTimeStackedLineSeries instance.
- Add the element instances to the line series.
- Add the line series to the plot area.
- Specify the x-axis date/time format.
Document document = new Document();
Page page = new Page();
document.Pages.Add(page);
Chart chart = new Chart(0, 0, 400, 400);
PlotArea plotArea = chart.PrimaryPlotArea;
Title title1 = new Title("Website Visitors");
Title title2 = new Title("Year - 2007");
chart.HeaderTitles.Add(title1);
chart.HeaderTitles.Add(title2);

DateTimeStackedLineSeriesElement seriesElement1 = new DateTimeStackedLineSeriesElement("Website A");
seriesElement1.Values.Add(5, new DateTime(2007, 1, 1));
seriesElement1.Values.Add(7, new DateTime(2007, 2, 1));
seriesElement1.Values.Add(9, new DateTime(2007, 3, 1));
seriesElement1.Values.Add(6, new DateTime(2007, 4, 1));
DateTimeStackedLineSeriesElement seriesElement2 = new DateTimeStackedLineSeriesElement("Website B");
seriesElement2.Values.Add(4, new DateTime(2007, 1, 1));
seriesElement2.Values.Add(2, new DateTime(2007, 2, 1));
seriesElement2.Values.Add(5, new DateTime(2007, 3, 1));
seriesElement2.Values.Add(8, new DateTime(2007, 4, 1));
DateTimeStackedLineSeriesElement seriesElement3 = new DateTimeStackedLineSeriesElement("Website C");
seriesElement3.Values.Add(2, new DateTime(2007, 1, 1));
seriesElement3.Values.Add(4, new DateTime(2007, 2, 1));
seriesElement3.Values.Add(6, new DateTime(2007, 3, 1));
seriesElement3.Values.Add(9, new DateTime(2007, 4, 1));

DateTimeStackedLineSeries stackedLineSeries1 = new DateTimeStackedLineSeries();
stackedLineSeries1.Add(seriesElement1);
stackedLineSeries1.Add(seriesElement2);
stackedLineSeries1.Add(seriesElement3);
plotArea.Series.Add(stackedLineSeries1);
stackedLineSeries1.XAxis.LabelFormat = "MMM";
page.Elements.Add(chart);
document.Draw(pdfFilePath);
' Create a PDF Document
Dim MyDocument As Document = New Document()

' Create a Page and add it to the document
Dim MyPage As Page = New Page()
MyDocument.Pages.Add(MyPage)

' Create a chart
Dim MyChart As Chart = New Chart(0, 0, 400, 200)

' Get the default plot area from the chart
Dim MyPlotArea As PlotArea = MyChart.PrimaryPlotArea

' Create header titles and add it to the chart
Dim MyTitle1 As Title = New Title("Website Visitors")
Dim MyTitle2 As Title = New Title("Year - 2007")
MyChart.HeaderTitles.Add(MyTitle1)
MyChart.HeaderTitles.Add(MyTitle2)

' Create a date time stacked line series element and add values to it
Dim MySeriesElement1 As DateTimeStackedLineSeriesElement = New DateTimeStackedLineSeriesElement("Website A")
MySeriesElement1.Values.Add(5, New DateTime(2007, 1, 1))
MySeriesElement1.Values.Add(7, New DateTime(2007, 2, 1))
MySeriesElement1.Values.Add(9, New DateTime(2007, 3, 1))
MySeriesElement1.Values.Add(6, New DateTime(2007, 4, 1))
Dim MySeriesElement2 As DateTimeStackedLineSeriesElement = New DateTimeStackedLineSeriesElement("Website B")
MySeriesElement2.Values.Add(4, New DateTime(2007, 1, 1))
MySeriesElement2.Values.Add(2, New DateTime(2007, 2, 1))
MySeriesElement2.Values.Add(5, New DateTime(2007, 3, 1))
MySeriesElement2.Values.Add(8, New DateTime(2007, 4, 1))
Dim MySeriesElement3 As DateTimeStackedLineSeriesElement = New DateTimeStackedLineSeriesElement("Website C")
MySeriesElement3.Values.Add(2, New DateTime(2007, 1, 1))
MySeriesElement3.Values.Add(4, New DateTime(2007, 2, 1))
MySeriesElement3.Values.Add(6, New DateTime(2007, 3, 1))
MySeriesElement3.Values.Add(9, New DateTime(2007, 4, 1))

' Create a date time stacked line series and add date time stacked line series elements to it
Dim MyStackedLineSeries1 As DateTimeStackedLineSeries = New DateTimeStackedLineSeries()
MyStackedLineSeries1.Add(MySeriesElement1)
MyStackedLineSeries1.Add(MySeriesElement2)
MyStackedLineSeries1.Add(MySeriesElement3)

' Add date time stacked line series to plot area
MyPlotArea.Series.Add(MyStackedLineSeries1)

' set label format for the axis labels
MyStackedLineSeries1.XAxis.LabelFormat = "MMM"

' Add the chart to the page
MyPage.Elements.Add(MyChart)

' Save the PDF
MyDocument.Draw(outputPath)
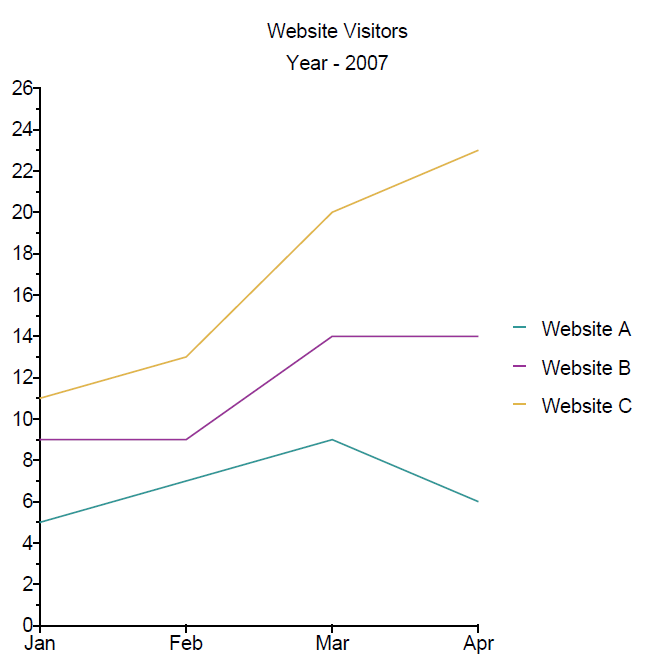
Figure 4. Stacked date/time line chart
100% Stacked
100% stacked charts are similar to stacked charts but the data is expressed as a percentage. These charts use the DateTimeXAxis or IndexedXAxis as the XAxis based on the series and PercentageYAxis as the YAxis.
Indexed
The following example illustrates adding 100% stacked indexed data to a chart. Perform the following steps to create the chart.
- Create a new Indexed100PercentStackedLineSeriesElement instance.
- Add the data to the instance.
- Repeat for as many instances as needed.
- Create an Indexed100PercentStackedLineSeries instance.
- Add the element instances to the series.
- Add the series to the plot area.
- Create the y-axis title.
- Add the x-axis labels as IndexedXAxisLabel instances.
// Create a PDF Document
Document document = new Document();
// Create a Page and add it to the document
Page page = new Page();
document.Pages.Add(page);

// Create a chart
Chart chart = new Chart(0, 0, 400, 230);
// Create a plot area
 PlotArea plotArea = chart.PrimaryPlotArea;

// Create header titles and add it to the chart
Title title1 = new Title("Website Visitors");
Title title2 = new Title("Year - 2007");
chart.HeaderTitles.Add(title1);
chart.HeaderTitles.Add(title2);

// Create indexed 100% line series elements and add values to it
Indexed100PercentStackedLineSeriesElement seriesElement1 = new Indexed100PercentStackedLineSeriesElement("Website A");
seriesElement1.Values.Add(new float[] { 5, 7, 9, 6 });
Indexed100PercentStackedLineSeriesElement seriesElement2 = new Indexed100PercentStackedLineSeriesElement("Website B");
seriesElement2.Values.Add(new float[] { 4, 2, 5, 8 });
Indexed100PercentStackedLineSeriesElement seriesElement3 = new Indexed100PercentStackedLineSeriesElement("Website C");
seriesElement3.Values.Add(new float[] { 2, 4, 6, 9 });

// Create a Indexed 100% Stacked Line Series
Indexed100PercentStackedLineSeries lineSeries = new Indexed100PercentStackedLineSeries();
// Add indexed 100% line series elements to the Indexed 100% Stacked Line Series
lineSeries.Add(seriesElement1);
lineSeries.Add(seriesElement2);
lineSeries.Add(seriesElement3);
// Add the series to the plot area
plotArea.Series.Add(lineSeries);

// Create a title and add it to the yaxis
Title lTitle = new Title("Visitors (in millions)");
lineSeries.YAxis.Titles.Add(lTitle);

//Adding AxisLabels to the XAxis
lineSeries.XAxis.Labels.Add(new IndexedXAxisLabel("Q1", 0));
lineSeries.XAxis.Labels.Add(new IndexedXAxisLabel("Q2", 1));
lineSeries.XAxis.Labels.Add(new IndexedXAxisLabel("Q3", 2));
lineSeries.XAxis.Labels.Add(new IndexedXAxisLabel("Q4", 3));

// Add the chart to the page
page.Elements.Add(chart);
// Save the PDF
document.Draw(pdfFilePath);
' Create a PDF Document
Dim MyDocument As New Document()
' Create a Page and add it to the MyDocument
Dim MyPage As New Page()
MyDocument.Pages.Add(MyPage)

' Create a MyChart
Dim MyChart As New Chart(0, 0, 400, 230)
' Create a plot area
Dim MyPlotArea As PlotArea = MyChart.PrimaryPlotArea

' Create header titles and add it to the MyChart
Dim MyTitle1 As New Title("Website Visitors")
Dim MyTitle2 As New Title("Year - 2007")
MyChart.HeaderTitles.Add(MyTitle1)
MyChart.HeaderTitles.Add(MyTitle2)

' Create indexed 100% line series elements and add values to it
Dim MySeriesElement1 As New Indexed100PercentStackedLineSeriesElement("Website A")
MySeriesElement1.Values.Add(New Single() {5, 7, 9, 6})
Dim MySeriesElement2 As New Indexed100PercentStackedLineSeriesElement("Website B")
MySeriesElement2.Values.Add(New Single() {4, 2, 5, 8})
Dim MySeriesElement3 As New Indexed100PercentStackedLineSeriesElement("Website C")
MySeriesElement3.Values.Add(New Single() {2, 4, 6, 9})

' Create a Indexed 100% Stacked Line Series
Dim MylineSeries As New Indexed100PercentStackedLineSeries()
'Add indexed 100% line series elements to the Indexed 100% Stacked Line Series
MylineSeries.Add(MySeriesElement1)
MylineSeries.Add(MySeriesElement2)
MylineSeries.Add(MySeriesElement3)
' Add the series to the plot area
MyPlotArea.Series.Add(MylineSeries)

'Create a title and add it to the yaxis
Dim MylTitle As New Title("Visitors (in millions)")
MylineSeries.YAxis.Titles.Add(MylTitle)

'Adding AxisLabels to the XAxis
MylineSeries.XAxis.Labels.Add(New IndexedXAxisLabel("Q1", 0))
MylineSeries.XAxis.Labels.Add(New IndexedXAxisLabel("Q2", 1))
MylineSeries.XAxis.Labels.Add(New IndexedXAxisLabel("Q3", 2))
MylineSeries.XAxis.Labels.Add(New IndexedXAxisLabel("Q4", 3))

' Add the MyChart to the MyPage
MyPage.Elements.Add(MyChart)
' Save the PDF
MyDocument.Draw(pdfFilePath)
Figure 5. Stacked 100% Line Chart
Date/Time
The following example illustrates adding 100% stacked date/time data to a chart. Perform the following steps to create the chart.
- Create a new DateTime100PercentStackedLineSeriesElement instance.
- Add the values to the instance, where each added value is the data value and the DateTime instance.
- Repeat for as many element instances needed.
- Create a DateTime100PercentStackedLineSeries instance.
- Add the element instance to the series.
- Add the series to the plot area.
- Set the x-axis date/time format.
Document document = new Document();
Page page = new Page();
document.Pages.Add(page);
Chart chart = new Chart(0, 0, 400, 400);
PlotArea plotArea = chart.PrimaryPlotArea;
Title title1 = new Title("Website Visitors");
Title title2 = new Title("Year - 2007");
chart.HeaderTitles.Add(title1);
chart.HeaderTitles.Add(title2);
DateTime100PercentStackedLineSeriesElement seriesElement1 = new DateTime100PercentStackedLineSeriesElement("Website A");
seriesElement1.Values.Add(5, new DateTime(2007, 1, 1));
seriesElement1.Values.Add(7, new DateTime(2007, 2, 1));
seriesElement1.Values.Add(9, new DateTime(2007, 3, 1));
seriesElement1.Values.Add(6, new DateTime(2007, 4, 1));
DateTime100PercentStackedLineSeriesElement seriesElement2 = new DateTime100PercentStackedLineSeriesElement("Website B");
seriesElement2.Values.Add(4, new DateTime(2007, 1, 1));
seriesElement2.Values.Add(2, new DateTime(2007, 2, 1));
seriesElement2.Values.Add(5, new DateTime(2007, 3, 1));
seriesElement2.Values.Add(8, new DateTime(2007, 4, 1));
DateTime100PercentStackedLineSeriesElement seriesElement3 = new DateTime100PercentStackedLineSeriesElement("Website C");
seriesElement3.Values.Add(2, new DateTime(2007, 1, 1));
seriesElement3.Values.Add(4, new DateTime(2007, 2, 1));
seriesElement3.Values.Add(6, new DateTime(2007, 3, 1));
seriesElement3.Values.Add(9, new DateTime(2007, 4, 1));
DateTime100PercentStackedLineSeries stackedLineSeries1 = new DateTime100PercentStackedLineSeries();
stackedLineSeries1.Add(seriesElement1);
stackedLineSeries1.Add(seriesElement2);
stackedLineSeries1.Add(seriesElement3);
plotArea.Series.Add(stackedLineSeries1);
stackedLineSeries1.XAxis.LabelFormat = "MMM";
page.Elements.Add(chart);
document.Draw(pdfFile);
' Create a PDF Document
Dim MyDocument As Document = New Document()

' Create a Page and add it to the document
Dim MyPage As Page = New Page()
MyDocument.Pages.Add(MyPage)

' Create a chart
Dim MyChart As Chart = New Chart(0, 0, 400, 200)

' Add a plot area to the chart
Dim MyPlotArea As PlotArea = MyChart.PrimaryPlotArea

' Create header titles and add it to the chart
Dim MyTitle1 As Title = New Title("Website Visitors")
Dim MyTitle2 As Title = New Title("Year - 2007")
MyChart.HeaderTitles.Add(MyTitle1)
MyChart.HeaderTitles.Add(MyTitle2)

' Create a date time 100 percent stacked line series element and add values to it
Dim MySeriesElement1 As DateTime100PercentStackedLineSeriesElement = New DateTime100PercentStackedLineSeriesElement("Website A")
MySeriesElement1.Values.Add(5, New DateTime(2007, 1, 1))
MySeriesElement1.Values.Add(7, New DateTime(2007, 2, 1))
MySeriesElement1.Values.Add(9, New DateTime(2007, 3, 1))
MySeriesElement1.Values.Add(6, New DateTime(2007, 4, 1))
Dim MySeriesElement2 As DateTime100PercentStackedLineSeriesElement = New DateTime100PercentStackedLineSeriesElement("Website B")
MySeriesElement2.Values.Add(4, New DateTime(2007, 1, 1))
MySeriesElement2.Values.Add(2, New DateTime(2007, 2, 1))
MySeriesElement2.Values.Add(5, New DateTime(2007, 3, 1))
MySeriesElement2.Values.Add(8, New DateTime(2007, 4, 1))
Dim MySeriesElement3 As DateTime100PercentStackedLineSeriesElement = New DateTime100PercentStackedLineSeriesElement("Website C")
MySeriesElement3.Values.Add(2, New DateTime(2007, 1, 1))
MySeriesElement3.Values.Add(4, New DateTime(2007, 2, 1))
MySeriesElement3.Values.Add(6, New DateTime(2007, 3, 1))
MySeriesElement3.Values.Add(9, New DateTime(2007, 4, 1))

' Create a date time 100 percent stacked line series and add date time 100 percent stacked line series elements to it
Dim MyStackedLineSeries1 As DateTime100PercentStackedLineSeries = New DateTime100PercentStackedLineSeries()
MyStackedLineSeries1.Add(MySeriesElement1)
MyStackedLineSeries1.Add(MySeriesElement2)
MyStackedLineSeries1.Add(MySeriesElement3)

' Add date time 100 percent stacked line series to plot area
MyPlotArea.Series.Add(MyStackedLineSeries1)

' set label  format for the axislabels
MyStackedLineSeries1.XAxis.LabelFormat = "MMM"

' Add the chart to the page
MyPage.Elements.Add(MyChart)

' Save the PDF
MyDocument.Draw(outputPath)
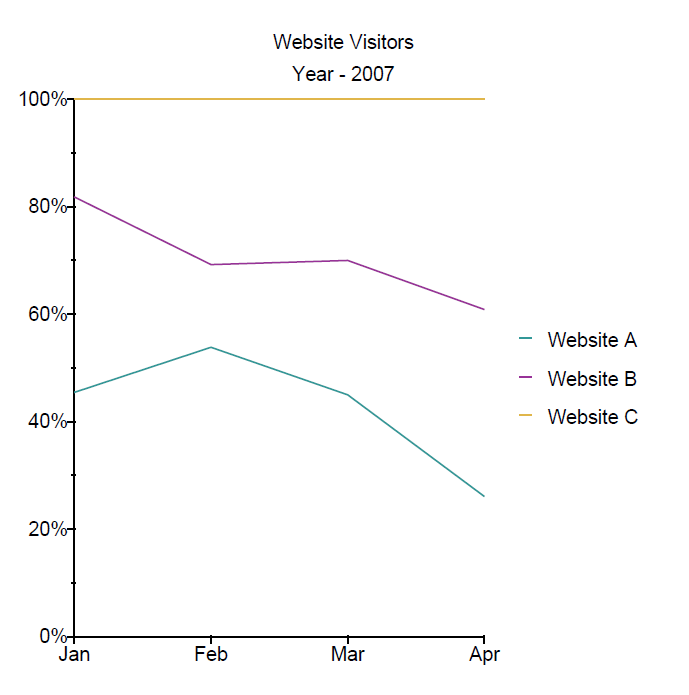
Figure 6. Stacked 100% date/time line chart