Pie Chart
Pie charts use a circle to display information. The circle is divided into different parts - "slices" - depending on the data. Each slice displays the related information. You use a PieSeries to create a pie chart.
PieSeries
The PieSeries is the data series that creates a pie chart. To create a pie chart, first create a Chart instance, its PlotArea, and then add the PieSeries.
Properties
The PieSeries has properties for customizing its position, dimensions, appearance, and data labeling. Refer to the PieSeries API documentation for a complete listing of properties.
ScalarDataLabel
When creating a pie series, you set the data label for the series by setting the DataLabel property. This property takes a ScalarDataLabel instance. This class allows customizing the data label that appears on each pie slice. You can modify its appearance, hide or show the value, and show percentages. Refer to the ScalarDataLabel API documentation for a complete listing of properties.
A pie series can also specify its label format as a percentage and display the data element's name. For example, the following sets the showValue property, showPercentage, and showElement constructor parameters to true.
ScalarDataLabel da = new ScalarDataLabel(true, true, true);
Dim Myda As ScalarDataLabel = New ScalarDataLabel(True, True, True)
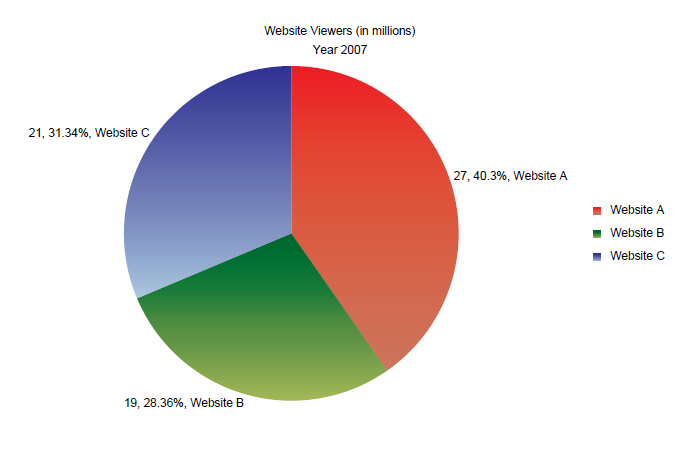
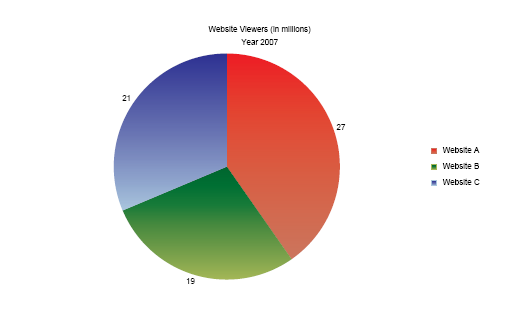
Figure 1. Setting the label to show value, name, and percentage.
Example
The following code illustrates creating a pie chart. To create a pie chart in this example perform the following steps.
- Create the PieSeries instance.
- Create the ScalarDataLabel instance and add it to the pie series.
- Add the data to the series using the Element collections Add method.
- Add the series to the chart's primary plot area.
- Assign a color to each Element in the series.
- Add the chart to the page and create the PDF.
// Create a PDF Document
Document document = new Document();
// Create a Page and add it to the document
document.Pages.Add(new Page(PageSize.A4, PageOrientation.Landscape));

// Create a chart
Chart chart = new Chart(0, 0, 700, 400);

// Create the Header titles and add it to the chart
Title tTitle = new Title("Website Viewers (in millions)");
Title tTitle1 = new Title("Year 2007");
chart.HeaderTitles.Add(tTitle);
chart.HeaderTitles.Add(tTitle1);

// Create a pie series
PieSeries pieSeries = new PieSeries();

// Create a scalar datalabel
ScalarDataLabel da = new ScalarDataLabel(true, false, false);

// Set scalar datalabel to the pie series
pieSeries.DataLabel = da;

//Add pie series elements to the pie series
pieSeries.Elements.Add(27, "Website A");
pieSeries.Elements.Add(19, "Website B");
pieSeries.Elements.Add(21, "Website C");

// Add series to the plot area
chart.PrimaryPlotArea.Series.Add(pieSeries);

//Assign colors to series elements
AutoGradient autogradient1 = new AutoGradient(90f, CmykColor.Red, CmykColor.IndianRed);
AutoGradient autogradient2 = new AutoGradient(90f, CmykColor.Green, CmykColor.YellowGreen);
AutoGradient autogradient3 = new AutoGradient(90f, CmykColor.Blue, CmykColor.LightBlue);

pieSeries.Elements[0].Color = autogradient1;
pieSeries.Elements[1].Color = autogradient2;
pieSeries.Elements[2].Color = autogradient3;

document.Page[0].Elements.Add(chart);
document.Draw(outputPath);
' Create a PDF Document
Dim MyDocument As New Document()

' Create a Page and add it to the MyDocument
Dim MyPage As New Page(PageSize.A4, PageOrientation.Landscape)
MyDocument.Pages.Add(MyPage)

' Create a MyChart
Dim MyChart = New Chart(0, 0, 700, 400)
' Add a plot area to the MyChart
Dim MyPlotArea As PlotArea = MyChart.PlotAreas.Add(50, 50, 300, 300)

' Create the Header titles and add it to the MyChart
Dim MytTitle As New Title("Website Viewers (in millions)")
Dim MytTitle1 As New Title("Year 2007")
MyChart.HeaderTitles.Add(MytTitle)
MyChart.HeaderTitles.Add(MytTitle1)

' Create autogradient colors
Dim MyAutogradient1 As AutoGradient = New AutoGradient(90.0F, CmykColor.Red, CmykColor.IndianRed)
Dim MyAutogradient2 As AutoGradient = New AutoGradient(90.0F, CmykColor.Green, CmykColor.YellowGreen)
Dim MyAutogradient3 As AutoGradient = New AutoGradient(90.0F, CmykColor.Blue, CmykColor.LightBlue)

' Create a scalar datalabel
Dim Myda As ScalarDataLabel = New ScalarDataLabel(True, False, False)
' Create a pie series
Dim MyPieSeries As New PieSeries()
' Set scalar datalabel to the pie series
MyPieSeries.DataLabel = Myda
' Add series to the plot area
MyPlotArea.Series.Add(MyPieSeries)

'Add pie series elements to the pie series
MyPieSeries.Elements.Add(27, "Website A")
MyPieSeries.Elements.Add(19, "Website B")
MyPieSeries.Elements.Add(21, "Website C")

' Assign autogradient colors to series elements
MyPieSeries.Elements(0).Color = MyAutogradient1
MyPieSeries.Elements(1).Color = MyAutogradient2
MyPieSeries.Elements(2).Color = MyAutogradient3

' Add the MyChart to the MyPage
MyPage.Elements.Add(MyChart)
' Save the pdf
MyDocument.Draw(pdfFilePath)
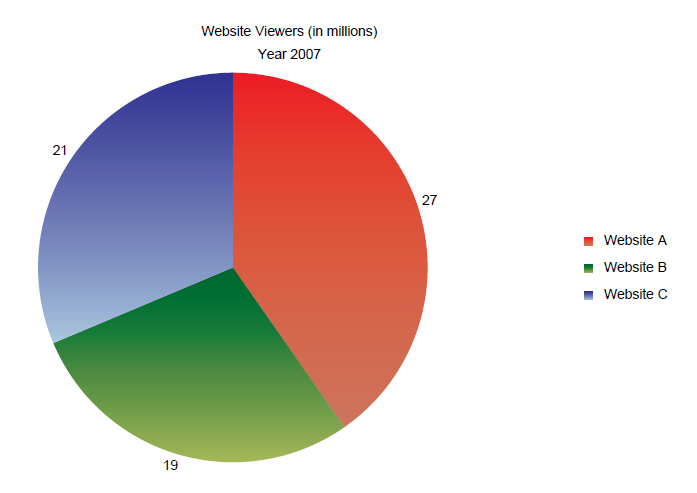
Figure 2. A pie chart example.