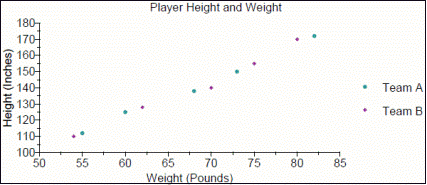
XYScatter Chart
Scatter charts are similar to line charts but differ in the x-axis. Different symbols are also used to display information in scatter charts. Scatter charts use numeric axes for both the x-axis and y-axis, whereas in line charts the x-axis is not numeric. Lines are not displayed in scatter charts unless the property LineDisplay is set to True.
XYScatterSeries
To create a scatter chart, use an XYScatterSeries. Use this class to configure your chart. An XYScatterSeries uses a NumericXAxis and NumericYAxis.
Example
The following example illustrates creating a scatter chart using an XYScatterSeries. Perform the following steps to create the chart.
- Create two XYScatterSeries instances and add values to both.
- Add the series to the plot area.
- Add the x-axis and y-axis titles.
- Add the chart to the page and create the PDF.
// Create a PDF Document
Document document = new Document();
// Create a Page and add it to the document
Page page = new Page();
document.Pages.Add(page);

// Create a chart
Chart chart = new Chart(0, 0, 450, 200);
// Add a plot Area to the chart
PlotArea plotArea = chart.PrimaryPlotArea;

// Create a Header title and add it to the chart
Title tTitle = new Title("Player Height and Weight");
chart.HeaderTitles.Add(tTitle);

// Create a xyScatter series and add values to it
XYScatterSeries xyScatterSeries1 = new XYScatterSeries("Team A");
xyScatterSeries1.Values.Add(112, 110);
xyScatterSeries1.Values.Add(125, 120);
xyScatterSeries1.Values.Add(138, 136);
xyScatterSeries1.Values.Add(150, 146);
xyScatterSeries1.Values.Add(172, 164);
XYScatterSeries xyScatterSeries2 = new XYScatterSeries("Team B");
xyScatterSeries2.Values.Add(110, 108);
xyScatterSeries2.Values.Add(128, 124);
xyScatterSeries2.Values.Add(140, 140);
xyScatterSeries2.Values.Add(155, 150);
xyScatterSeries2.Values.Add(170, 160);

// Add xyScatter series to the plot Area
plotArea.Series.Add(xyScatterSeries1);
plotArea.Series.Add(xyScatterSeries2);

// Create axis titles and add it to the axis
Title title1 = new Title("Height (Inches)");
Title title2 = new Title("Weight (Pounds)");
xyScatterSeries1.YAxis.Titles.Add(title1);
xyScatterSeries1.XAxis.Titles.Add(title2);

// Add the chart to the page
page.Elements.Add(chart);
// Save the PDF
document.Draw(pdfFilePath);
' Create a PDF Document
Dim MyDocument As New Document()
' Create a Page and add it to the document
Dim MyPage As New Page()
MyDocument.Pages.Add(MyPage)

' Create a chart
Dim MyChart As New Chart(0, 0, 450, 200)
' Add a plot Area to the chart
Dim MyPlotArea As PlotArea = MyChart.PrimaryPlotArea

' Create a Header title and add it to the chart
Dim MytTitle As New Title("Player Height and Weight")
MyChart.HeaderTitles.Add(MytTitle)

' Create a xyScatter series and add values to it
Dim MyXYScatterSeries1 As New XYScatterSeries("Team A")
MyXYScatterSeries1.Values.Add(112, 110)
MyXYScatterSeries1.Values.Add(125, 120)
MyXYScatterSeries1.Values.Add(138, 136)
MyXYScatterSeries1.Values.Add(150, 146)
MyXYScatterSeries1.Values.Add(172, 164)
Dim MyXYScatterSeries2 As New XYScatterSeries("Team B")
MyXYScatterSeries2.Values.Add(110, 108)
MyXYScatterSeries2.Values.Add(128, 124)
MyXYScatterSeries2.Values.Add(140, 140)
MyXYScatterSeries2.Values.Add(155, 150)
MyXYScatterSeries2.Values.Add(170, 160)

' Add xyScatter series to the plot Area
MyPlotArea.Series.Add(MyXYScatterSeries1)
MyPlotArea.Series.Add(MyXYScatterSeries2)

' Create axis titles and add it to the axis
Dim Mytitle1 As New Title("Height (Inches)")
Dim Mytitle2 As New Title("Weight (Pounds)")
MyXYScatterSeries1.YAxis.Titles.Add(Mytitle1)
MyXYScatterSeries1.XAxis.Titles.Add(Mytitle2)

' Add the chart to the page
MyPage.Elements.Add(MyChart)
' Save the PDF
MyDocument.Draw(pdfFilePath)

Figure 1. An example XYScatter Chart