Axis
An axis is a reference line measuring distances or angles in a coordinate system. One or more axis are contained in a plot area. A PlotArea has a default x-axis (XAxis) and a default y-axis (YAxis). But a PlotArea is not limited to the default axis and can have multiple x and y axes.
You are not required to create axes. Unless specified, a series creates the appropriate axis class subclass and assigns the appropriate values for the axis by default.
Axis By Series
The following table lists the x-axis and y-axis associated with each respective series.
See the API documentation for each axis type for a complete code example.
XAxis
An x-axis (specified by the XAxis class) is the horizontal axis of a two-dimensional Cartesian coordinate system. To change an XAxis position - on the plot area's bottom by default - use the XAxisAnchorType enumeration.
To specify a series-specific type of x-axis, use code similar to the following (using the appropriate XAxis subclass depending upon the series).
NumericXAxis axis = barSeries.XAxis;
DateTimeXAxis axis2 = dateTimeSeries.XAxis;
Dim MyAxis As NumericXAxis = MyBarSeries.XAxis
Dim MyAxis2 AS DateTimeXAxis = MyDateTimeSeries.XAxis
The XAxis creates the appropriate default x-axis if not specified. It can be retrieved from the PlotArea or Series after adding the Series to SeriesList.
The XAxis has the following sub-classes for each of the different x-axis types (see table above).
- NumericXAxis
- DateTimeXAxis
- PercentageXAxis
- IndexedXAxis
Refer to the following GitHub examples for each of the the x-axis types. You can also refer to the API documentation of each x-axis type for another code example.
XAxis Properties
The XAxis has properties for anchoring, its label appearance, grid lines, tick marks, and numerous other properties for modifying an x-axis appearance. Refer to the API documentation for properties specific to each XAxis subclass.
XAxis Intervals
It is unnecessary to set maximum or minimum values or intervals for an axis, as the provided data calculate these values. However, the x-axis subclasses also have Min, Max, and Interval properties for specifying the minimum and maximum series values. But be sure to set the subclass label's AutoLabels property to False if you specify an x-axis's intervals.
myAxis.Min = 185;
myYAxis.Max = 235;
myYAxis.Interval = 10;
myYAxis.Labels.AutoLabels = False;
NumericXAxis
The NumericXAxis uses numeric data, displays the values using NumericXAxisLabels, and places the NumericXAxis on the plot area. See the table above for a listing showing the series that use a NumericXAxis.
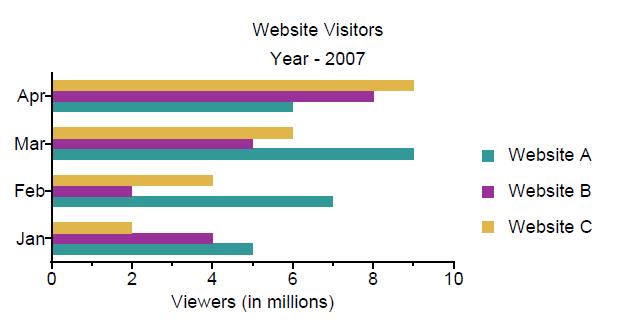 Figure 1. A date time bar chart with a NumericXAxis.
DateTimeXAxis
The DateTimeXAxis uses date and time data, displays the values using DateTimeXAxisLabels, and places the DateTimeXAxis on the plot area. See the table above for a listing showing the series that use a DateTimeXAxis.
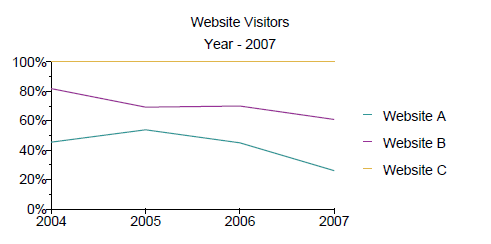 Figure 2. A date/time 100% stacked line chart with a DateTimeXAxis.
PercentageXAxis
The PercentageXAxis uses numeric data in percentage format, displays the values using PercentageXAxisLabels, and places the PercentageXAxis on the plot area. See the table above for a listing showing the series that use a PercentageXAxis.
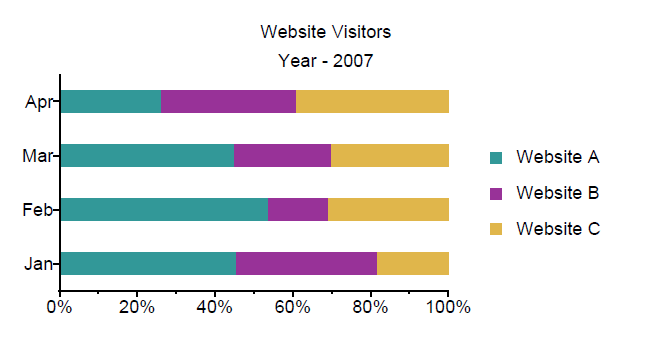 Figure 3. A date/time 100% stacked bar chart with a PercentageXAxis.
IndexedXAxis
The IndexedXAxis uses non-numeric data, displays the values using IndexedXAxisLabel, and places the IndexedXAxis on the plot area. See the table above for a listing showing the series that uses an IndexedXAxis.
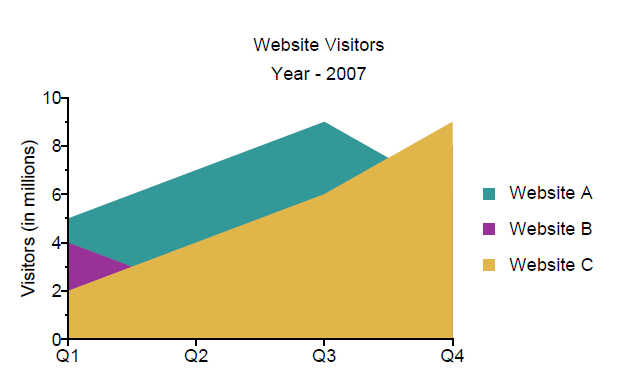 Figure 4. An indexed area chart with a IndexedXAxis.
YAxis
A y-axis (specified by the YAxis class) is the vertical axis of a two-dimensional Cartesian coordinate system. To change the y-axis - to the left of the plot area by default - use the YAxisAnchorType enumeration.
A y-axis position can also be changed to the plot area's right or floating (refer to the YAxisAnchorType API documentation for details).
myYAxis.AnchorType = YAxisAnchorType.Left;
To specify a specific type of y-axis from a series, use code similar to the following (using the appropriate YAxis subclass depending upon the series).
IndexedYAxis yAxis = barSeries.YAxis;
NumericYAxis yAxis2 = dateTimeSeries.YAxis;
Dim MyYAxis As IndexedYAxis = MyBarSeries.YAxis
Dim MyYAxis2 As NumericYAxis = MyDateTimeSeries.YAxis;
The YAxis uses the appropriate default y-axis if not specified. The default y-axis type can be retrieved from the PlotArea or Series after adding the series to the SeriesList.
The YAxis has the following sub-classes for each y-axis type (see table above).
- NumericYAxis
- DateTimeYAxis
- PercentageYAxis
- IndexedYAxis
Refer to the following GitHub examples for each of the the y-axis types. You can also refer to the API documentation of each y-axis type for another code example.
YAxis Properties
The YAxis class has numerous properties that allow modifying an axis's appearance, including: anchor, label format, grid lines, tick marks, and other properties. Refer to the API documentation for properties specific to each YAxis subclass.
YAxis Intervals
It is unnecessary to set maximum or minimum values or intervals for an axis, as the provided data calculate these values. However, the y-axis subclasses also have Min, Max, and Interval properties for specifying the minimum and maximum series values. But be sure to set the subclass label's AutoLabels property to False.
myAxis.Min = 185;
myYAxis.Max = 235;
myYAxis.Interval = 10;
myYAxis.Labels.AutoLabels = False;
NumericYAxis
The NumericYAxis uses numeric data, displays the values using NumericYAxisLabels, and places the NumericYAxis on the plot area. See the table above for a listing showing the series that use a NumericYAxis.
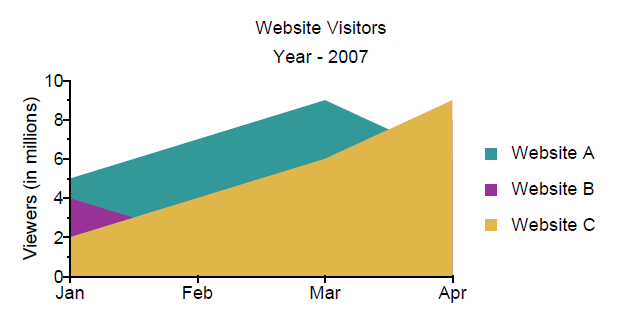 Figure 5. A date time area chart with a NumericYAxis.
DateTimeYAxis
The DateTimeYAxis uses date and time data, displays the values using DateTimeYAxisLabels, and places the DateTimeYAxis on the plot area. See the table above for a listing showing the series that use a DateTimeYAxis.
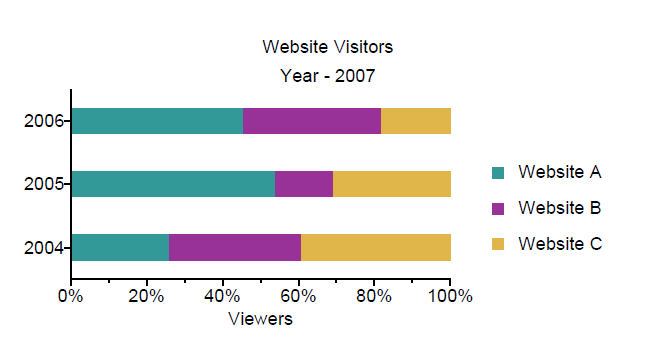 Figure 6. A date/time 100% stacked bar chart with a DateTimeYAxis.
PercentageYAxis
The PercentageYAxis uses numeric data in percentage format, displays the values using PercentageYAxisLabels, and places the PercentageYAxis on the plot area. See the table above for a listing showing the series that use a PercentageYAxis.
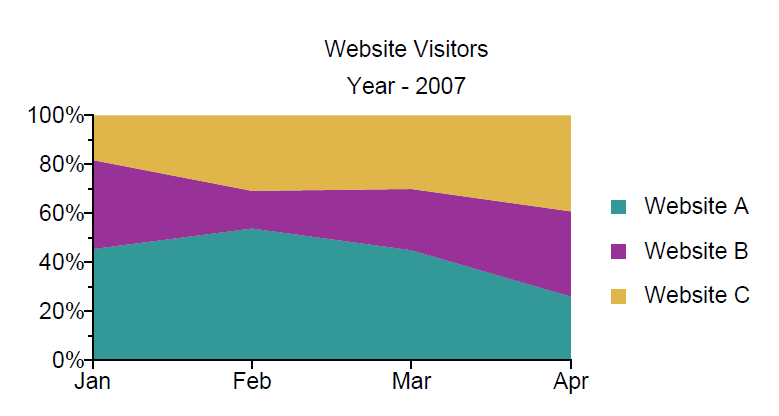 Figure 7. A date/time 100% stacked area chart with a PercentageYAxis.
IndexedYAxis
The IndexedYAxis uses non-numeric data, displays the values using IndexedYAxisLabels, and places the IndexedYAxis on the plot area. See the table above for a listing showing the series that uses an IndexedYAxis.
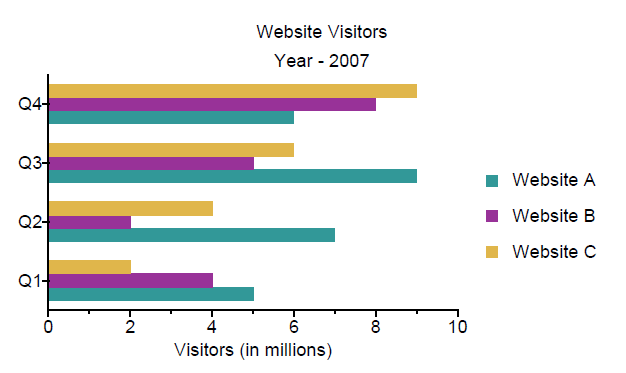 Figure 8. An indexed bar chart with a IndexedXAxis.
Examples