Legend
Legends (Legend) map colors or symbols to a chart. A Chart contains a Legends property which consists of a LegendList. Add one or more Legend instances to the LegendList to add multiple legends to a chart. A series can also add a Legend to a chart. For example, a ColumnSeries has a Legend property.
A chart has a LegendList property for adding multiple legends. A series has a Legend property allowing adding and accessing only one Legend.
Properties
A legend has numerous properties for modifying its appearance. For example, you can modify a legend's background color.
Legend myLegend = chart.Legends.Add(2, 3, 100, 50);
myLegend.BackgroundColor = RgbColor.Tan;
Dim myLegend As Legend = chart.Legends.Add(2, 3, 100, 50)
myLegend.BackgroundColor = RgbColor.Tan
You can, of course, also access the legend using the chart's Legends collection.
chart.Legends[0].BackgroundColor = RgbColor.Tan;
chart.Legends[0].BackgroundColor = RgbColor.Tan
Refer to the API documentation for the Legend class for a complete property listing (Legend) .
Formatting and Use
A Legend is automatically created and added to a Chart instance's LegendList if the first series added to the Chart instance's PlotArea does not already have a legend.
- If a Chart instance's AutoLayout property is
True, the Legend visually occupies 35% of the chart's width. - If a Chart instance's AutoLayout property is
Falsethen you must manually set the Legend instance's X, Y, Width and Height properties to control the legend's placement.
When creating a legend, if you wish to control the legend's location and dimensions then you must disable auto-layout.
You must manually place a legend's location on a chart if auto-layout is disabled.
LegendPlacement
Legend(s) placement is controlled using the LegendList instance's Placement property. The LegendPlacement property is an enumeration specifying the location to place the legend. Values are BottomCenter, BottomLeft, BottomRight, LeftCenter, RightCenter, TopCenter, TopLeft, and TopRight.
LegendPlacement only works when auto-layout is enabled.
For example, the following illustrates placing the legends on a chart's bottom left.
chart.Legends.Placement = LegendPlacement.BottomLeft;
chart.Legends.Placement = LegendPlacement.BottomLeft
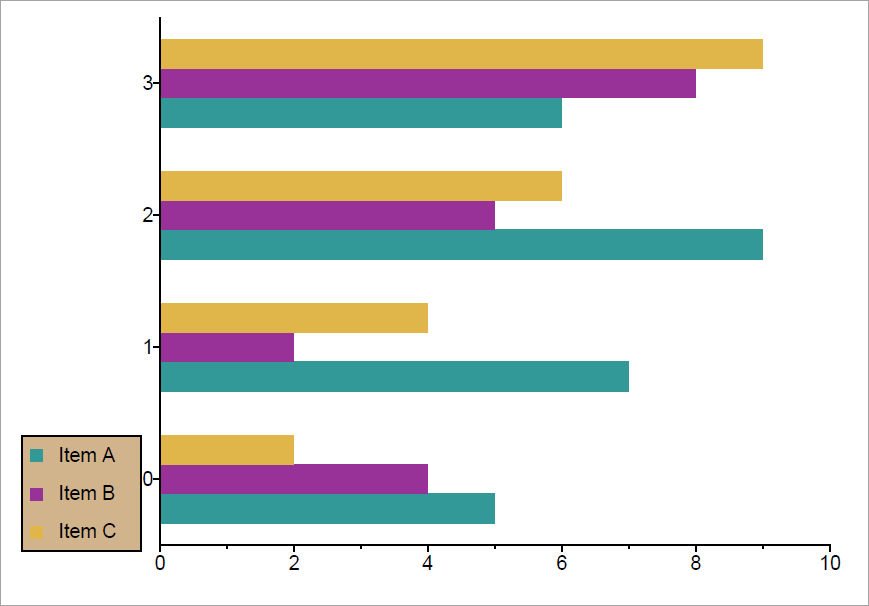 Figure 1. A legend placed on a chart's bottom left.
By default, the LegendPlacement is set to RightCenter.
Legend Labels Layout
By default, legends layout their labels vertically. To change the label layout to horizontal, change the chart's Legends classes LabelsLayout property.
chart.Legends.LabelsLayout = LayOut.Horizontal;
chart.Legends.LabelsLayout = LayOut.Horizontal
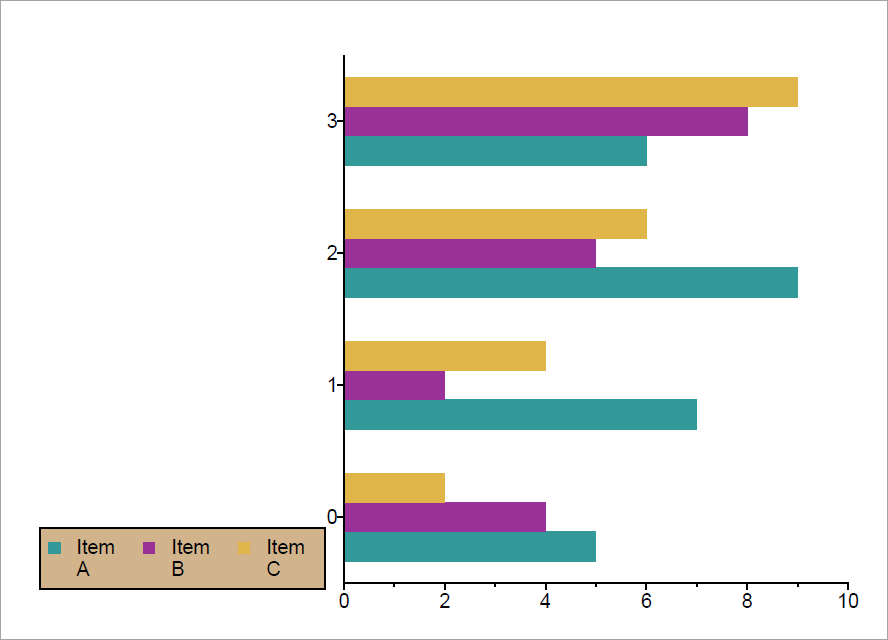 Figure 2. A legend with horizontal legend labels.
Legend Label
When adding a Legend to a series, the Name property is used as the text to list on the legend. For example, the following code would add A, B, and C as the legend items.
PieSeriesElement pe1 = new(10, "A", RgbColor.Green);
PieSeriesElement pe2 = new(20, "B", RgbColor.Red);
PieSeriesElement pe3 = new(13, "C", RgbColor.Purple);
Dim pe1 As New PieSeriesElement(10, "A", System.Drawing.Color.Green)
Dim pe2 As New PieSeriesElement(20, "B", System.Drawing.Color.Red)
Dim pe3 As New PieSeriesElement(13, "C", System.Drawing.Color.Purple)
Legend labels can also be modified, once created. For example, you can change the label color and text.
chart.Legends[0].LegendLabelList[0].TextColor = RgbColor.OrangeRed
chart.Legends[0].LegendLabelList[1].Text = chart.Legends[0].LegendLabelList[1].Text + " (highest value)"
chart.Legends[0].LegendLabelList[0].TextColor = RgbColor.OrangeRed;
chart.Legends[0].LegendLabelList[1].Text = chart.Legends[0].LegendLabelList[1].Text + " (highest value)";
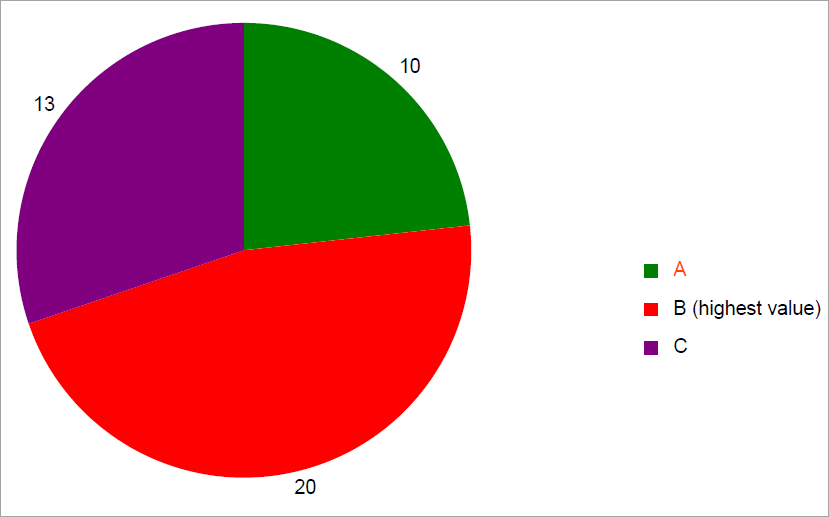 Figure 3. A legend with modified labels.
Multiple Legends
A chart can have multiple legends. Add legends through a Chart instance's LegendsList property's Add method.
Default Legend
When adding the first Legend to a LegendList, by default all series titles are added to the legend. The first Legend instance is the default legend. All series are then added to that Legend. For example, see the multiple plot areas example in the Plot Area topic (Plot Area). In that example, despite two plot areas, all values are displayed in the same legend (the default legend).
Adding Legends
To change the default legend behavior, create a new Legend (which assigns it to the LegendList) and then explicitly assign the series to that new legend. By doing this, you change the default behavior and you can assign different legends to different data series.
The following example illustrates. In this example, two legends are created and the first two data series are assigned to the first legend while the second two data series are assigned to the second legend.
Document document = new Document();
Page page = new Page();
document.Pages.Add(page);

float hght = document.Pages[0].Dimensions.Height - document.Pages[0].Dimensions.TopMargin * 2;
float wdth = document.Pages[0].Dimensions.Width - document.Pages[0].Dimensions.RightMargin * 2;

Chart chart = new Chart(0, 0, wdth, hght);
PlotArea plotArea1 = chart.PlotAreas.Add(50, 10, 150, 200);
PlotArea plotArea2 = chart.PlotAreas.Add(250, 10, 150, 200);

Legend legend = chart.Legends.Add();
legend.BorderColor = RgbColor.Black;
legend.BackgroundColor = RgbColor.Tan;
legend.BorderStyle = LineStyle.DashSmall;

Legend legend2 = chart.Legends.Add();
legend2.BackgroundColor = RgbColor.Teal;
legend2.BorderColor = RgbColor.Black;
legend2.BorderStyle = LineStyle.Solid;

IndexedBarSeries barSeries1 = new IndexedBarSeries("Item A");
barSeries1.Legend = legend;
plotArea1.Series.Add(barSeries1);
 barSeries1.Values.Add(new float[] { 5, 7, 9, 6 });
IndexedBarSeries barSeries2 = new IndexedBarSeries("Item B");
barSeries2.Legend = legend;
plotArea1.Series.Add(barSeries2);
barSeries2.Values.Add(new float[] { 4, 2, 5, 8 });

IndexedBarSeries barSeries4 = new IndexedBarSeries("Item 1");
barSeries4.Legend = legend2;
plotArea2.Series.Add(barSeries4);
barSeries4.Values.Add(new float[] { 3, 4, 6, 6 });
IndexedBarSeries barSeries5 = new IndexedBarSeries("Item 2");
barSeries5.Legend = legend2;
plotArea2.Series.Add(barSeries5);
barSeries5.Values.Add(new float[] { 4, 2, 6, 7 });


page.Elements.Add(chart);
document.Draw(outputPath);
Dim document As New Document()
Dim page As New Page()
document.Pages.Add(page)

Dim hght As Single = document.Pages(0).Dimensions.Height - document.Pages(0).Dimensions.TopMargin * 2
Dim wdth As Single = document.Pages(0).Dimensions.Width - document.Pages(0).Dimensions.RightMargin * 2

Dim chart As New Chart(0, 0, wdth, hght)

Dim plotArea1 As PlotArea = chart.PlotAreas.Add(50, 10, 150, 200)
Dim plotArea2 As PlotArea = chart.PlotAreas.Add(250, 10, 150, 200)

Dim legend As Legend = chart.Legends.Add()
legend.BorderColor = RgbColor.Black
legend.BackgroundColor = RgbColor.Tan
legend.BorderStyle = LineStyle.DashSmall

Dim legend2 As Legend = chart.Legends.Add()
legend2.BackgroundColor = RgbColor.LightBlue
legend2.BorderColor = RgbColor.Black
legend2.BorderStyle = LineStyle.Solid

Dim barSeries1 As New IndexedBarSeries("Item A")
barSeries1.Legend = legend
plotArea1.Series.Add(barSeries1)
barSeries1.Values.Add(New Single() {5, 7, 9, 6})

Dim barSeries2 As New IndexedBarSeries("Item B")
barSeries2.Legend = legend
plotArea1.Series.Add(barSeries2)
barSeries2.Values.Add(New Single() {4, 2, 5, 8})

Dim barSeries4 As New IndexedBarSeries("Item 1")
barSeries4.Legend = legend2
plotArea2.Series.Add(barSeries4)
barSeries4.Values.Add(New Single() {3, 4, 6, 6})

Dim barSeries5 As New IndexedBarSeries("Item 2")
barSeries5.Legend = legend2
plotArea2.Series.Add(barSeries5)
barSeries5.Values.Add(New Single() {4, 2, 6, 7})

page.Elements.Add(chart)
document.Draw(outputPath)
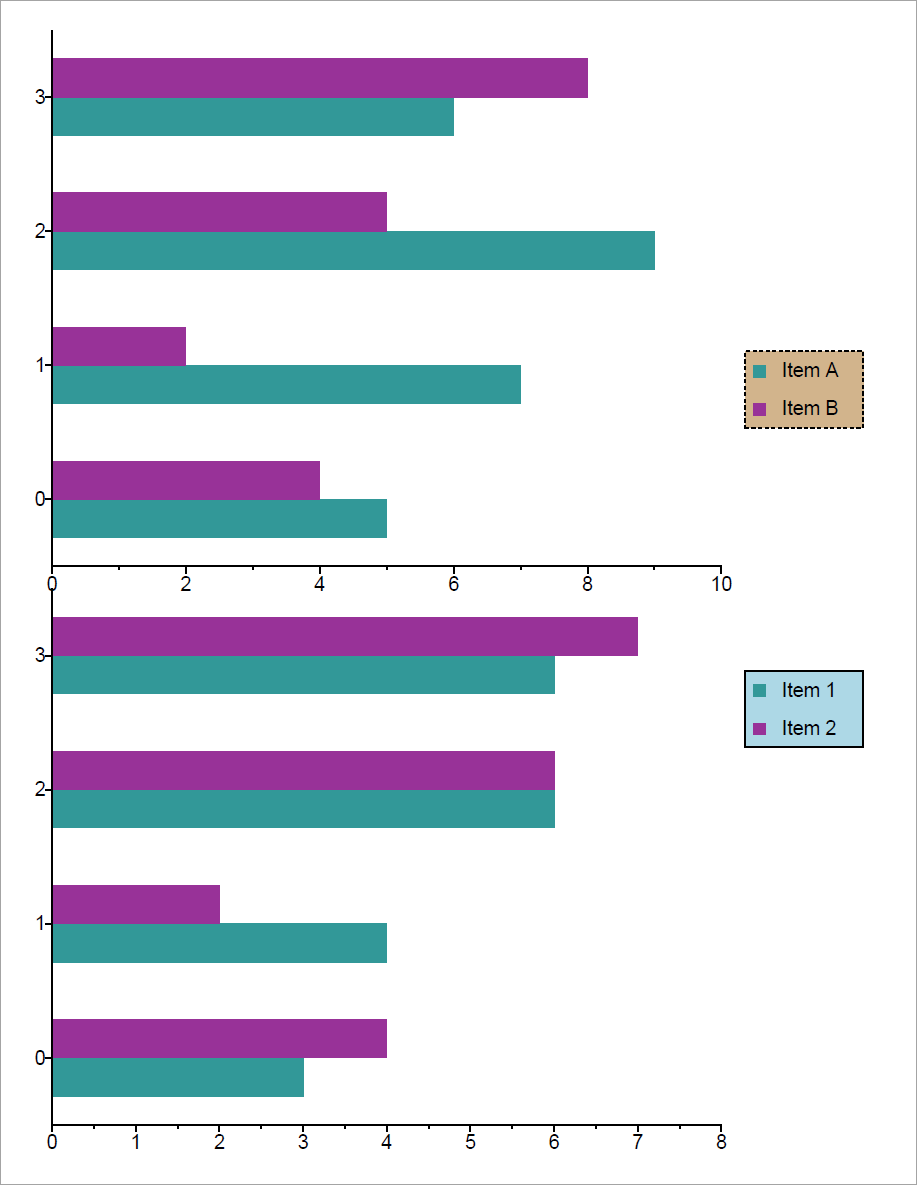 Figure 4. A legend with multiple legends.