Plot Area
A Chart contains one or more plot areas. The PlotArea contains one or more series and is the area within the bounds of the chart where the series is plotted.
If modifying or manually creating a plot area, you must set AutoLayout to false or the chart automatically determines layout.
By default, every Chart instance contains a PrimaryPlotArea, and every plot area has an x-axis and y-axis. You can override the primary plot area by creating your own or by modifying the primary plot area dimensions.
A plot area has access to the chart containing the plot area through the Chart property, it is safer to change the chart itself rather than through the plot area. For example, although it might seem obvious, the following is an easy mistake to make. The following code would change the background color for the entire chart not only the second plot area!
Chart chart = new Chart(0, 0, wdth, hght);
PlotArea plotArea1 = chart.PlotAreas.Add(50, 10, 150, 200);
PlotArea plotArea2 = chart.PlotAreas.Add(250, 10, 150, 200);
// changes baground of chart not only plotArea2!
plotArea2.Chart.BackgroundColor = RgbColor.Red;
Dim chart = New Chart(0, 0, wdth, hght)
Dim plotArea1 As PlotArea = MyChart.PlotAreas.Add(50, 10, 150, 200)
Dim plotArea2 As PlotArea = MyChart.PlotAreas.Add(50, 10, 150, 200)
// changes baground of chart not only plotArea2!
plotArea2.Chart.BackgroundColor = RgbColor.Red;
Titles
You can add an optional top and bottom title to a plot area. The TopTitles and BottomTitles are collections of Title instances to allow multiple titles. You can also modify a title's properties.
Chart chart = new Chart(0, 0, 400, 200);
Title topTitle = new Title("DynamicPDF Item Report");
topTitle.FontSize = 24;
Title subTitle = new Title("For the 2024 Calendar Year.");
Title bottomTitle = new Title("Produced by CeTe 2024");
bottomTitle.FontSize = 6;
chart.HeaderTitles.Add(topTitle);
chart.HeaderTitles.Add(subTitle);
chart.FooterTitles.Add(bottomTitle)

Title title = new Title("Item Count");
title.FontSize = 8;
Title title2 = new Title("In thousands of items.");
title2.FontSize = 8;
chart.PrimaryPlotArea.TopTitles.Add(title);
chart.PrimaryPlotArea.BottomTitles.Add(title2);
Dim chart As New Chart(0, 0, 400, 200)
Dim topTitle As New Title("DynamicPDF Item Report")
topTitle.FontSize = 24
Dim subTitle As New Title("For the 2024 Calendar Year.")
Dim bottomTitle As New Title("Produced by CeTe 2024")
bottomTitle.FontSize = 6

chart.HeaderTitles.Add(topTitle)
chart.HeaderTitles.Add(subTitle)
chart.FooterTitles.Add(bottomTitle)

Dim title As New Title("Item Count")
title.FontSize = 8
Dim title2 As New Title("In thousands of items.")
title2.FontSize = 8
chart.PrimaryPlotArea.TopTitles.Add(title)
chart.PrimaryPlotArea.BottomTitles.Add(title2)
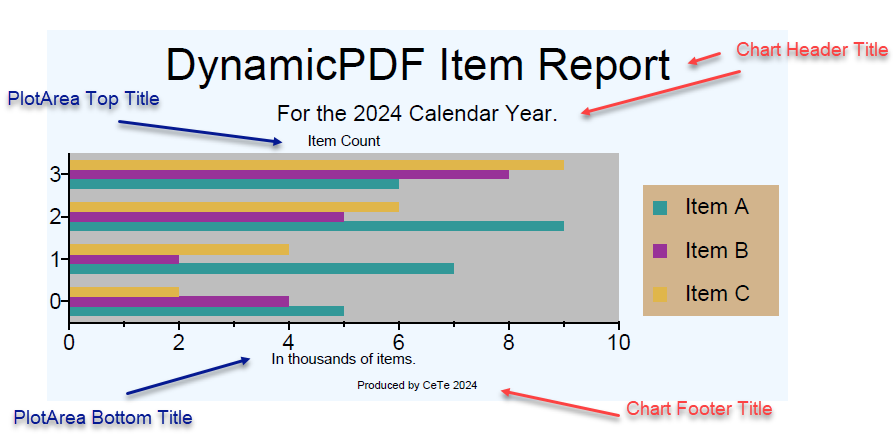 Figure 1. A plot area with a title and footer title.
A chart also has titles that you can modify.
Modifying Primary Plot Area
You can modify the primary plot area by accessing it through the chart, for example, the following code-snippet, taken from the third example in Charts Overview, illustrates modifying a primary plot area's dimensions.
chart.AutoLayout = false;
chart.PrimaryPlotArea.Height = 150;
chart.PrimaryPlotArea.Width = 175;
chart.PrimaryPlotArea.X = 200;
chart.PrimaryPlotArea.Y = 25;
chart.AutoLayout = false;
chart.PrimaryPlotArea.Height = 150;
chart.PrimaryPlotArea.Width = 175;
chart.PrimaryPlotArea.X = 200;
chart.PrimaryPlotArea.Y = 25;
Creating a Plot Area
To create a now plot area, add a new PlotArea to the Chart instance's PlotAreas property (PlotAreaList). That plot area is then used by the chart rather than the primary plot area. The following example illustrates manually creating a plot area for a Pie chart. The plot area defines its owns dimensions rather than allowing the chart to use the primary plot area. After adding the series it then disables auto-layout and places the legend in the desired location. Note that the background colors are only to help visualize the plot and legend placement in relationship to the chart.
Document document = new();
document.Pages.Add(new Page());

Chart chart = new Chart(0, 0, 500, 500);
chart.BackgroundColor = RgbColor.LightBlue;

PlotArea plotArea = chart.PlotAreas.Add(10, 100, 300, 300);
plotArea.BackgroundColor = RgbColor.Tan;
PieSeries pieSeries = new PieSeries();
ScalarDataLabel dataLbl = new ScalarDataLabel(true, false, false);
pieSeries.DataLabel = dataLbl;
plotArea.Series.Add(pieSeries);
PieSeriesElement pe1 = new(10, "A", RgbColor.Green);
PieSeriesElement pe2 = new(20, "B", RgbColor.Red);
PieSeriesElement pe3 = new(13, "C", RgbColor.Purple);

pieSeries.Elements.Add(pe1);
pieSeries.Elements.Add(pe2);
pieSeries.Elements.Add(pe3);

chart.AutoLayout = false;
chart.Legends[0].X = 400;
chart.Legends[0].Y = 250;

document.Pages[0].Elements.Add(chart);
document.Draw(outputPath);
Dim document As New Document()
document.Pages.Add(New Page())

Dim chart As New Chart(0, 0, 500, 500)
chart.BackgroundColor = RgbColor.LightBlue
chart.AutoLayout = False

Dim plotArea As PlotArea = chart.PlotAreas.Add(10, 100, 100, 100)
plotArea.BackgroundColor = RgbColor.Tan
Dim pieSeries As New PieSeries()
Dim dataLbl As New ScalarDataLabel(True, False, False)
pieSeries.DataLabel = dataLbl

plotArea.Series.Add(pieSeries)
Dim pe1 As New PieSeriesElement(10, "A", RgbColor.Green)
Dim pe2 As New PieSeriesElement(20, "B", RgbColor.Red)
Dim pe3 As New PieSeriesElement(13, "C", RgbColor.Purple)

pieSeries.Elements.Add(pe1)
pieSeries.Elements.Add(pe2)
pieSeries.Elements.Add(pe3)

chart.Layout()

chart.Legends(0).X = 400
chart.Legends(0).Y = 250

document.Pages(0).Elements.Add(chart)
document.Draw(outputPath)
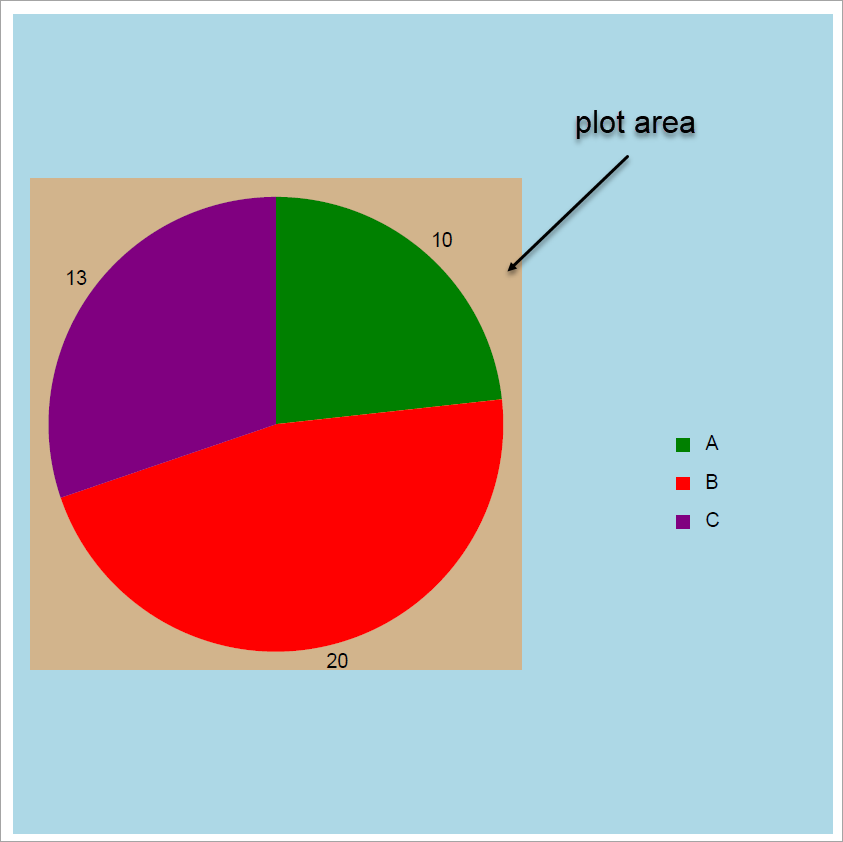 Figure 2. A Pie chart with a manually created plot area.
You can create a plot area without setting AutoLayout to false, but any modifications in dimensions you make to that plot area are ignored.
Multiple Plot Areas
A chart can also have multiple plot areas. The following example illustrates adding two plot areas to the same chart. Note that it manually lays out the chart to ensure the plot areas are sized and placed correctly.
A chart can have multiple legends associated with a data series, see the Legend topic for more information.
Document document = new Document();
Page page = new Page();
document.Pages.Add(page);

float hght = document.Pages[0].Dimensions.Height - document.Pages[0].Dimensions.TopMargin * 2;
float wdth = document.Pages[0].Dimensions.Width - document.Pages[0].Dimensions.RightMargin * 2;

Chart chart = new Chart(0, 0, wdth, hght);
chart.BackgroundColor = RgbColor.AliceBlue;

PlotArea plotArea1 = chart.PlotAreas.Add(50, 10, 150, 200);
PlotArea plotArea2 = chart.PlotAreas.Add(250, 10, 150, 200);

IndexedBarSeries barSeries1 = new IndexedBarSeries("Item A");
plotArea1.Series.Add(barSeries1);
barSeries1.Values.Add(new float[] { 5, 7, 9, 6 });
IndexedBarSeries barSeries2 = new IndexedBarSeries("Item B");
plotArea1.Series.Add(barSeries2);
barSeries2.Values.Add(new float[] { 4, 2, 5, 8 });
IndexedBarSeries barSeries3 = new IndexedBarSeries("Item C");
plotArea1.Series.Add(barSeries3);
barSeries3.Values.Add(new float[] { 2, 4, 6, 9 });

IndexedBarSeries barSeries4 = new IndexedBarSeries("Item 1");
plotArea2.Series.Add(barSeries4);
barSeries4.Values.Add(new float[] { 3, 4, 6, 6 });
IndexedBarSeries barSeries5 = new IndexedBarSeries("Item 2");
plotArea2.Series.Add(barSeries5);
barSeries5.Values.Add(new float[] { 4, 2, 6, 7 });
IndexedBarSeries barSeries6 = new IndexedBarSeries("Item 3");
plotArea2.Series.Add(barSeries6);
barSeries6.Values.Add(new float[] { 2, 2, 6, 3 });

chart.AutoLayout = false;
chart.Legends[0].X = 50;
chart.Legends[0].BorderStyle = LineStyle.Solid;
chart.Legends[0].BorderColor = RgbColor.Black;
chart.Legends[0].Y = plotArea1.Height + 55;
page.Elements.Add(chart);
document.Draw(outputPath);
Dim document As New Document()
Dim page As New Page()
document.Pages.Add(page)

Dim hght As Single = document.Pages(0).Dimensions.Height - document.Pages(0).Dimensions.TopMargin * 2
Dim wdth As Single = document.Pages(0).Dimensions.Width - document.Pages(0).Dimensions.RightMargin * 2

Dim chart As New Chart(0, 0, wdth, hght)
chart.BackgroundColor = RgbColor.AliceBlue

Dim plotArea1 As PlotArea = chart.PlotAreas.Add(50, 10, 150, 200)
Dim plotArea2 As PlotArea = chart.PlotAreas.Add(250, 10, 150, 200)

Dim barSeries1 As New IndexedBarSeries("Item A")
plotArea1.Series.Add(barSeries1)
barSeries1.Values.Add(New Single() {5, 7, 9, 6})
Dim barSeries2 As New IndexedBarSeries("Item B")
plotArea1.Series.Add(barSeries2)
barSeries2.Values.Add(New Single() {4, 2, 5, 8})
Dim barSeries3 As New IndexedBarSeries("Item C")
plotArea1.Series.Add(barSeries3)
barSeries3.Values.Add(New Single() {2, 4, 6, 9})

Dim barSeries4 As New IndexedBarSeries("Item 1")
plotArea2.Series.Add(barSeries4)
barSeries4.Values.Add(New Single() {3, 4, 6, 6})
Dim barSeries5 As New IndexedBarSeries("Item 2")
plotArea2.Series.Add(barSeries5)
barSeries5.Values.Add(New Single() {4, 2, 6, 7})
Dim barSeries6 As New IndexedBarSeries("Item 3")
plotArea2.Series.Add(barSeries6)
barSeries6.Values.Add(New Single() {2, 2, 6, 3})

chart.AutoLayout = False
chart.Legends(0).X = 50
chart.Legends(0).BorderStyle = LineStyle.Solid
chart.Legends(0).BorderColor = RgbColor.Black
chart.Legends(0).Y = plotArea1.Height + 55

page.Elements.Add(chart)
document.Draw(outputPath)
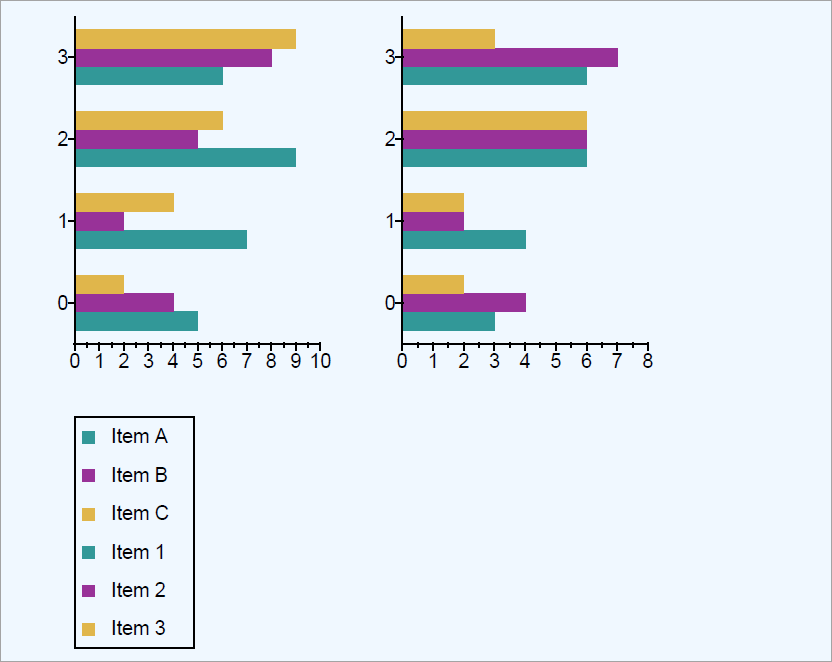 Figure 3. A chart with a multiple plot area.
A chart can have different types of data series added to its plot areas. For example, the following illustrates placing a bar chart and a pie chart on the same chart with two plot areas. The first plot area uses several IndexedBarSeries while the second uses a PieSeries.
Chart chart = new Chart(0, 0, wdth, hght);
chart.BackgroundColor = RgbColor.AliceBlue;

PlotArea plotArea1 = chart.PlotAreas.Add(50, 10, 150, 200);
PlotArea plotArea2 = chart.PlotAreas.Add(250, 10, 150, 200);

IndexedBarSeries barSeries1 = new IndexedBarSeries("Item A");
plotArea1.Series.Add(barSeries1);
barSeries1.Values.Add(new float[] { 5, 7, 9, 6 });

IndexedBarSeries barSeries2 = new IndexedBarSeries("Item B");
plotArea1.Series.Add(barSeries2);
barSeries2.Values.Add(new float[] { 4, 2, 5, 8 });

IndexedBarSeries barSeries3 = new IndexedBarSeries("Item C");
plotArea1.Series.Add(barSeries3);
barSeries3.Values.Add(new float[] { 2, 4, 6, 9 });
PieSeries pieSeries = new PieSeries();

ScalarDataLabel dataLbl = new ScalarDataLabel(true, false, false);
pieSeries.DataLabel = dataLbl;
plotArea2.Series.Add(pieSeries);

PieSeriesElement pe1 = new(10, "A", RgbColor.Green);
PieSeriesElement pe2 = new(20, "B", RgbColor.Red);
PieSeriesElement pe3 = new(13, "C", RgbColor.Purple);

pieSeries.Elements.Add(pe1);
pieSeries.Elements.Add(pe2);
pieSeries.Elements.Add(pe3);

chart.AutoLayout = false;
chart.Legends[0].X = 50;
chart.Legends[0].BorderStyle = LineStyle.Solid;
chart.Legends[0].BorderColor = RgbColor.Black;
chart.Legends[0].Y = plotArea1.Height + 55;

page.Elements.Add(chart);
document.Draw(outputPath);
Dim document As New Document()
Dim page As New Page()
document.Pages.Add(page)

Dim hght As Single = document.Pages(0).Dimensions.Height - document.Pages(0).Dimensions.TopMargin * 2
Dim wdth As Single = document.Pages(0).Dimensions.Width - document.Pages(0).Dimensions.RightMargin * 2

Dim chart As New Chart(0, 0, wdth, hght)
chart.BackgroundColor = RgbColor.AliceBlue

Dim plotArea1 As PlotArea = chart.PlotAreas.Add(50, 10, 150, 200)
Dim plotArea2 As PlotArea = chart.PlotAreas.Add(250, 10, 150, 200)

Dim barSeries1 As New IndexedBarSeries("Item A")
plotArea1.Series.Add(barSeries1)
barSeries1.Values.Add(New Single() {5, 7, 9, 6})

Dim barSeries2 As New IndexedBarSeries("Item B")
plotArea1.Series.Add(barSeries2)
barSeries2.Values.Add(New Single() {4, 2, 5, 8})

Dim barSeries3 As New IndexedBarSeries("Item C")
plotArea1.Series.Add(barSeries3)
barSeries3.Values.Add(New Single() {2, 4, 6, 9})

Dim pieSeries As New PieSeries()
Dim dataLbl As New ScalarDataLabel(True, False, False)
pieSeries.DataLabel = dataLbl

plotArea2.Series.Add(pieSeries)

Dim pe1 As New PieSeriesElement(10, "A", RgbColor.Green)
Dim pe2 As New PieSeriesElement(20, "B", RgbColor.Red)
Dim pe3 As New PieSeriesElement(13, "C", RgbColor.Purple)

pieSeries.Elements.Add(pe1)
pieSeries.Elements.Add(pe2)
pieSeries.Elements.Add(pe3)

chart.AutoLayout = False
chart.Legends(0).X = 50
chart.Legends(0).BorderStyle = LineStyle.Solid
chart.Legends(0).BorderColor = RgbColor.Black
chart.Legends(0).Y = plotArea1.Height + 55

page.Elements.Add(chart)
document.Draw(outputPath)
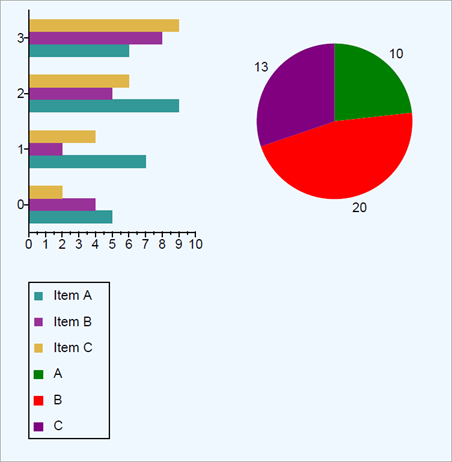
Recall that all plot areas in a chart are automatically laid-out when a Chart object's AutoLayout property is True (the default value). All plot areas inside the chart automatically determines and vertically aligns all plot areas within the chart unless disabling auto-layout. Setting a Chart instance's AutoLayout property to False requires manually configuring all values.