Charts
DynamicPDF Core Suite for .NET has built-in support for six different charting types. The charts rendered by DynamicPDF are vector based, allowing them to be scaled without losing resolution. Like page elements, charts can be placed anywhere on a page.
Chart Types
Core Suite offers the following chart types.
Review the available chart elements and how to format those elements before jumping into the documentation on the different available charts.
Creating Charts
Use the following steps to create a chart.
- Instantiate a Chart.
- Instantiate a Series.
- Add the series to the Chart instance's PrimaryPlotArea.
- Fill the series with values (or fill it with series elements).
- Add any chart titles, axis data, etc. to the series or chart
- Add the Chart to the Page it is to be displayed on.
Chart
A chart is a collection of PlotAreas. Usually, a chart only requires a single PlotArea, although a chart can have numerous PlotAreas. By default, a chart has a primary PlotArea already created (called the PrimaryPlotArea), which allows you to add a data series without requiring you to specify a PlotArea.
Every chart has a default plot area and doesn't require you to create a new plot area.
Adding Series
When a series is first added to a PlotArea, the PlotArea uses that initial series to logically determine numerous property values for the PlotArea and the chart. For example, the axis, axis labels, tick marks, and legend are all created by default when the series is added to a PlotArea.
Allowing a PlotArea to determine its relevant property values simplifies an overall chart's creation.
Simple Example
The following example illustrates the steps listed above on how to create a chart. This example creates a simple bar chart and adds it to a page.
First it creates a new Chart instance.
Then it defines three IndexedBarSeries and adds them to the PrimaryPlotArea.
When the first series is added to the PlotArea, the specific type of X and Y Axis for that PlotArea are automatically determined along with the min and max axis values (based on the values in that series passed in). The legend is also automatically created and adds an entry for the series. The PlotArea also determines if the new series can share the same axis. If it cannot share the axis, then it creates and adds an appropriate new axis. Also note that if it cannot share the axis, the min and max values on the axis will usually require adjusting.
- The page instance then adds the chart as a page element.
- Finally, the document draws the created PDF to a file.
Document document = new Document();
Page page = new Page();
document.Pages.Add(page);

Chart chart = new Chart(0, 0, 400, 200);

IndexedBarSeries barSeries1 = new IndexedBarSeries("Item A");
chart.PrimaryPlotArea.Series.Add(barSeries1);
barSeries1.Values.Add(new float[] { 5, 7, 9, 6 });
IndexedBarSeries barSeries2 = new IndexedBarSeries("Item B");
chart.PrimaryPlotArea.Series.Add(barSeries2);
barSeries2.Values.Add(new float[] { 4, 2, 5, 8 });
IndexedBarSeries barSeries3 = new IndexedBarSeries("Item C");
chart.PrimaryPlotArea.Series.Add(barSeries3);
barSeries3.Values.Add(new float[] { 2, 4, 6, 9 });

page.Elements.Add(chart);
document.Draw(outputPath);
Dim document As New Document()
Dim page As New Page()
document.Pages.Add(page)

Dim chart As New Chart(0, 0, 400, 200)

Dim barSeries1 As New IndexedBarSeries("Item A")
chart.PrimaryPlotArea.Series.Add(barSeries1)
barSeries1.Values.Add(New Single() {5, 7, 9, 6})
Dim barSeries2 As New IndexedBarSeries("Item B")
chart.PrimaryPlotArea.Series.Add(barSeries2)
barSeries2.Values.Add(New Single() {4, 2, 5, 8})
Dim barSeries3 As New IndexedBarSeries("Item C")
chart.PrimaryPlotArea.Series.Add(barSeries3)
barSeries3.Values.Add(New Single() {2, 4, 6, 9})

page.Elements.Add(chart)
document.Draw(outputPath)
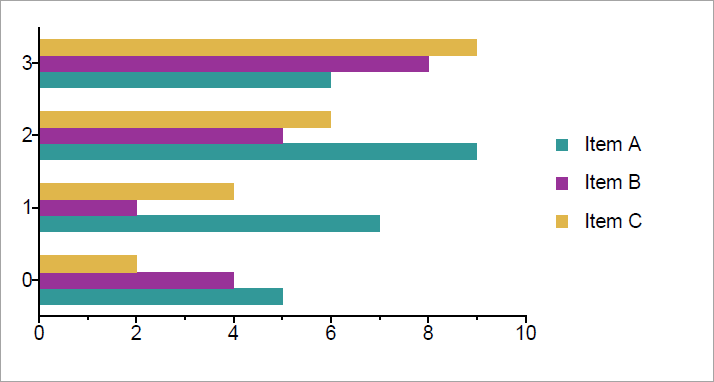 Figure 1. A basic bar chart.
Using a Non-Default Axis
You can use your own custom axis in a plot area. To use a non-default axis you create a new axis and then pass the instance into the series constructor. The following example illustrates adding a custom x axis and y axis to the bar chart in the previous example.
Document document = new Document();
Page page = new Page();
document.Pages.Add(page);

Chart chart = new Chart(0, 0, 400, 200);

// Create a indexed yAxis
IndexedYAxis yAxis = new IndexedYAxis();

// Create indexed y axis labels and add those to indexed y Axis
yAxis.Labels.Add(new IndexedYAxisLabel("Q1", 0));
yAxis.Labels.Add(new IndexedYAxisLabel("Q2", 1));
yAxis.Labels.Add(new IndexedYAxisLabel("Q3", 2));
yAxis.Labels.Add(new IndexedYAxisLabel("Q4", 3));

// Create a numeric xAxis
NumericXAxis xAxis = new NumericXAxis();

IndexedBarSeries barSeries1 = new IndexedBarSeries("Item A", xAxis, yAxis);
chart.PrimaryPlotArea.Series.Add(barSeries1);
barSeries1.Values.Add(new float[] { 5, 7, 9, 6 });
IndexedBarSeries barSeries2 = new IndexedBarSeries("Item B", xAxis, yAxis);
chart.PrimaryPlotArea.Series.Add(barSeries2);
barSeries2.Values.Add(new float[] { 4, 2, 5, 8 });
IndexedBarSeries barSeries3 = new IndexedBarSeries("Item C", xAxis, yAxis);
chart.PrimaryPlotArea.Series.Add(barSeries3);
barSeries3.Values.Add(new float[] { 2, 4, 6, 9 });

page.Elements.Add(chart);
document.Draw(outputPath);
Dim document As New Document()
Dim page As New Page()
document.Pages.Add(page)

Dim chart As New Chart(0, 0, 400, 200)

' Create an indexed yAxis
Dim yAxis As New IndexedYAxis()

' Create indexed y axis labels and add those to indexed y Axis
yAxis.Labels.Add(New IndexedYAxisLabel("Q1", 0))
yAxis.Labels.Add(New IndexedYAxisLabel("Q2", 1))
yAxis.Labels.Add(New IndexedYAxisLabel("Q3", 2))
yAxis.Labels.Add(New IndexedYAxisLabel("Q4", 3))

' Create a numeric xAxis
Dim xAxis As New NumericXAxis()

' Create a title and add it to the XAxis

Dim barSeries1 As New IndexedBarSeries("Item A", xAxis, yAxis)
chart.PrimaryPlotArea.Series.Add(barSeries1)
barSeries1.Values.Add(New Single() {5, 7, 9, 6})
Dim barSeries2 As New IndexedBarSeries("Item B", xAxis, yAxis)
chart.PrimaryPlotArea.Series.Add(barSeries2)
barSeries2.Values.Add(New Single() {4, 2, 5, 8})
Dim barSeries3 As New IndexedBarSeries("Item C", xAxis, yAxis)
chart.PrimaryPlotArea.Series.Add(barSeries3)
barSeries3.Values.Add(New Single() {2, 4, 6, 9})

page.Elements.Add(chart)
document.Draw(outputPath)
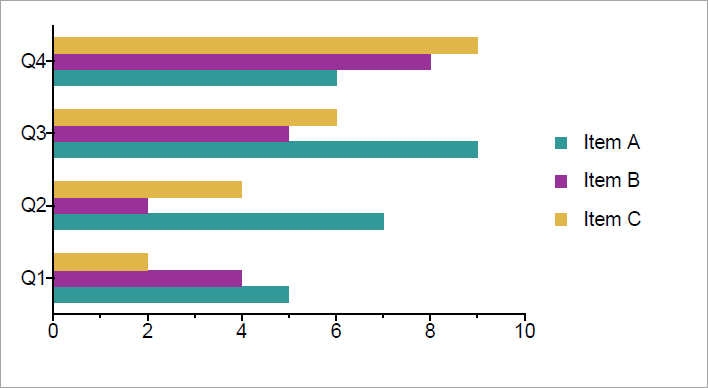 Figure 2. A basic bar chart with a custom axes.
Different data series use different axes. For example, the DataTimeAreaSeries uses a DateTimeXAxis and a NumericYAxis as its axes. Refer to the Axis documentation topic for a complete list (Axis).
Manual Chart Layout
You can chose to manually layout a chart in its entirety, or by only modifying a few element properties. You can control the positioning and dimensions of a chart's plot area(s) and legend(s) by disabling auto-layout for a chart. However, having to layout every chart element is difficult. Moreover, often only a few properties need to be changed to achieve the desired layout. Instead, you can rely on the chart element's default layout and then modify only a few particular properties to achieve the desired appearance.
Modifying Layout
By default, the AutoLayout property of a Chart instance is set to True, indicating that the, X, Y, Width and Height properties for all the chart elements (the plot areas and legends) are calculated automatically.
You must set AutoLayout to false to manually layout a chart.
If you wish to modify only certain aspects of a chart's layout, then use the following steps to modify the position of any chart elements.
- Ensure the element that you want to change the location of are already added to the chart (either directly or indirectly).
- Set the Chart instance's AutoLayout property to
False. - Call the chart's Layout method.
- Manually set the desired element properties.
Calling the Layout method determines the default layout for all chart elements.
For example, if we changed the example above to include the following code, you can see it changes the legend's location and changes the primary plot's size and location.
chart.AutoLayout = false;
chart.Layout();
chart.Legends[0].X = 20;
chart.Legends[0].Y = 75;
chart.Legends[0].BackgroundColor = RgbColor.Tan;
chart.PrimaryPlotArea.Height = 150;
chart.PrimaryPlotArea.Width = 175;
chart.PrimaryPlotArea.X = 200;
chart.PrimaryPlotArea.Y = 25;
chart.AutoLayout = false;
chart.Layout();
chart.Legends[0].X = 20;
chart.Legends[0].Y = 75;
chart.Legends[0].BackgroundColor = RgbColor.Tan;
chart.PrimaryPlotArea.Height = 150;
chart.PrimaryPlotArea.Width = 175;
chart.PrimaryPlotArea.X = 200;
chart.PrimaryPlotArea.Y = 25;
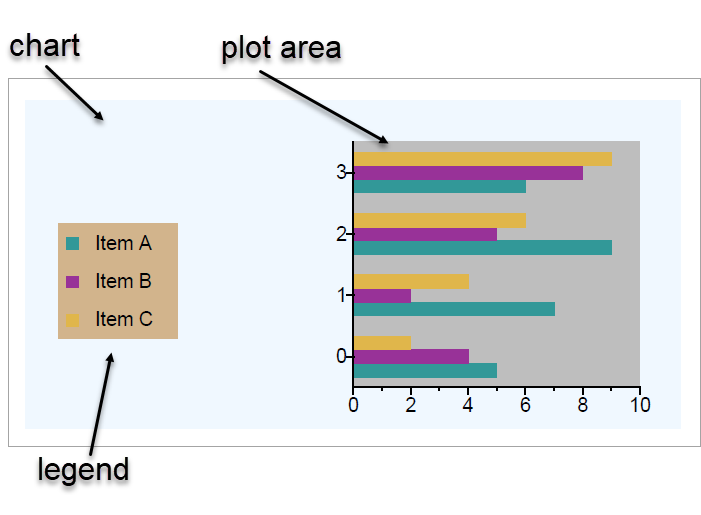 Figure 4. A basic bar chart illustrating manual layout.
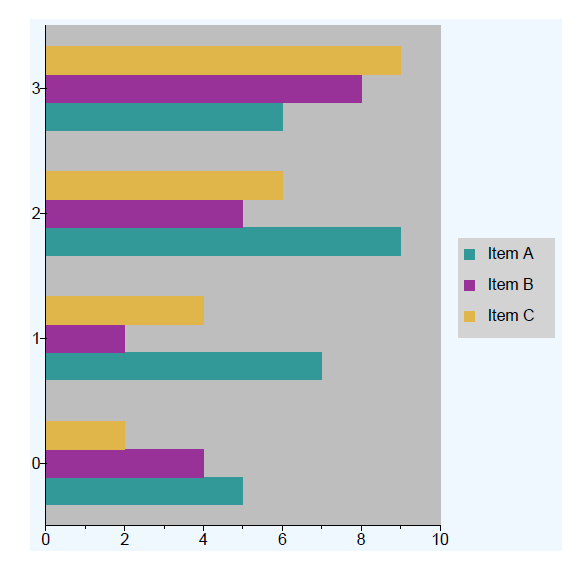
Manual Layout
You can also manually layout an chart in its entirety. To do this you disable auto-layout after creating the chart and then manually layout the chart's elements. You do not call the Layout method, as this method will change the properties you just manually configured.
For example, consider the following example.
Document document = new Document();
Page page = new Page();
document.Pages.Add(page);

Chart chart = new Chart(0, 0, 400, 400);
chart.BackgroundColor = RgbColor.AliceBlue;
chart.AutoLayout = false;

Legend legend = chart.Legends.Add(20, 75, 75, 75);
legend.BackgroundColor = RgbColor.LightGrey;

PlotArea plotArea = chart.PlotAreas.Add(200, 25, 175, 150);
plotArea.BackgroundColor = RgbColor.Gray;

IndexedBarSeries barSeries1 = new IndexedBarSeries("Item A");
plotArea.Series.Add(barSeries1);
barSeries1.Values.Add(new float[] { 5, 7, 9, 6 });
IndexedBarSeries barSeries2 = new IndexedBarSeries("Item B");
plotArea.Series.Add(barSeries2);
barSeries2.Values.Add(new float[] { 4, 2, 5, 8 });
IndexedBarSeries barSeries3 = new IndexedBarSeries("Item C");
plotArea.Series.Add(barSeries3);
barSeries3.Values.Add(new float[] { 2, 4, 6, 9 });

page.Elements.Add(chart);
document.Draw(outputPath);
Dim document As New Document()
Dim page As New Page()
document.Pages.Add(page)

Dim chart As New Chart(0, 0, 400, 400)
chart.BackgroundColor = RgbColor.AliceBlue
chart.AutoLayout = False

Dim legend As Legend = chart.Legends.Add(20, 75, 75, 75)
legend.BackgroundColor = RgbColor.LightGrey

Dim plotArea As PlotArea = chart.PlotAreas.Add(200, 25, 175, 150)
plotArea.BackgroundColor = RgbColor.Gray

Dim barSeries1 As New IndexedBarSeries("Item A")
plotArea.Series.Add(barSeries1)
barSeries1.Values.Add(New Single() {5, 7, 9, 6})
Dim barSeries2 As New IndexedBarSeries("Item B")
plotArea.Series.Add(barSeries2)
barSeries2.Values.Add(New Single() {4, 2, 5, 8})
Dim barSeries3 As New IndexedBarSeries("Item C")
plotArea.Series.Add(barSeries3)
barSeries3.Values.Add(New Single() {2, 4, 6, 9})

chart.Layout()

page.Elements.Add(chart)
document.Draw(outputPath)
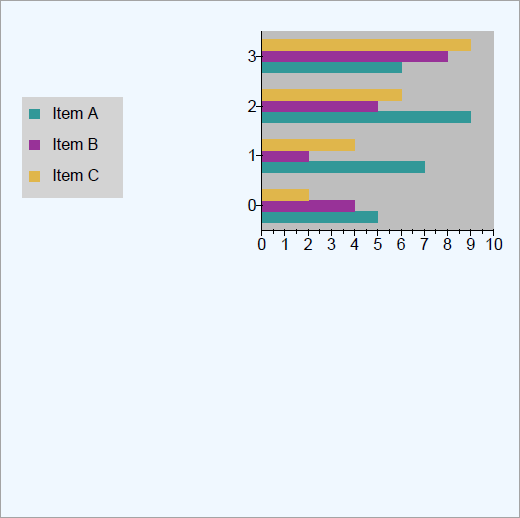 Figure 5. A bar chart with manual layout.
Do not call Layout if manually configuring your entire chart, as this will invalidate your custom layout. If in the above example, you added chart.Layout() just above the page.Elements.Add(chart) code, then the resulting chart is automatically calculated rather than using your manual configuration.
The Layout method automatically lays out your chart as the default layout. Use this method combined with disabling auto-layout to tweak your chart layout's layout.