Titles
The Title class provides a description describing a chart, plot area, x-axis, or y-axis. Titles are displayed on a single line. Text that does not fit on one line is truncated. However, you can add multiple titles to charts, plot areas, the x-axis, and the y-axis. Add titles to a chart by setting a HeaderTitle and/or a FooterTitle. Add titles to plot areas by setting a TopTitles and/or BottomTitles. Add titles to an x-axis or y-axis by setting the Title class.
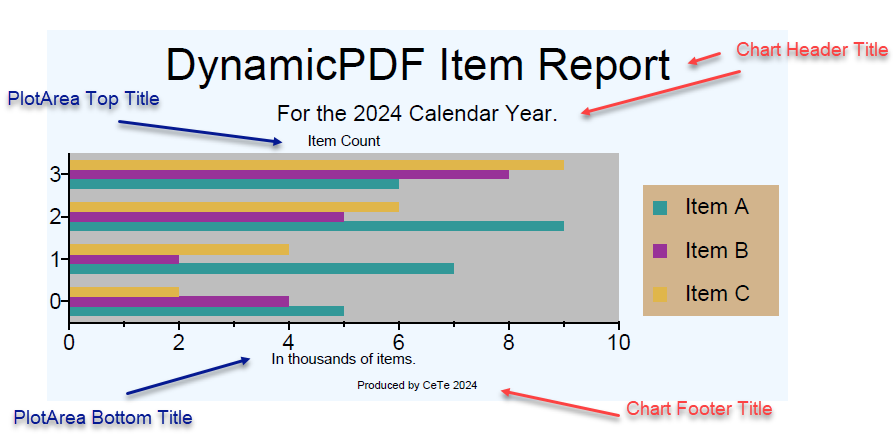 Figure 1. A chart and plot area with titles.
Title
Use the Title class to add and display individual titles in a titles list. Titles are displayed on a single line. Text that does not fit on one line is truncated.
Refer to the Title API documentation for a complete example.
Properties
A Title has the following properties.
| Property | Description |
|---|---|
| Align | Gets or sets the alignment. |
| Font | Gets or sets the Font object to use for the font. |
| FontSize | Gets or sets the FontSize. |
| Height | Gets or sets the height. |
| TextColor | Gets or sets the Color object to use as the TextColor of the Title. |
| Titles | Gets or sets the text. |
| Width | Gets or sets the width. |
Chart Titles
Add titles to charts using the HeaderTitles and FooterTitles properties. These two properties of the Chart class are both instances of a TitleList that contains one or more Title instances. The HeaderTitles property places titles on a chart's top while the FooterTitles property places titles on the chart's bottom.
The following code illustrates adding header titles and footer titles to a chart.
Chart chart = new Chart(0, 0, 300, 200);
Title title1 = new Title("Header Title");
Title title2 = new Title("Footer Title");
chart.HeaderTitles.Add(title1);
chart.FooterTitles.Add(title2);
Dim MyChart As Chart = New Chart(0, 0, 300, 200)
Dim MyTitle1 As Title = New Title("Header Title")
Dim MyTitle2 As Title = New Title("Footer Title")
MyChart.HeaderTitles.Add(title1)
MyChart.FooterTitles.Add(title2)
Refer to the Chart API documentation for a complete example.
Plot Area Titles
A PlotArea class has a TopTitles property and a BottomTitles property. These two properties are both instances of a TitleList that contains one or more Title instances. The TopTitles property causes the title text to appear at a plot's top while the BottomTitles property cause the title text to appear at the bottom.
The following code shows how to add top and bottom titles to a plot area.
Chart chart = new Chart(0, 0, 300, 200);
PlotArea plotArea = chart.PrimaryPlotArea;
Title title1 = new Title("Top Title");
Title title2 = new Title("Bottom Title");
plotArea.TopTitles.Add(title1);
plotArea.BottomTitles.Add(title2);
Dim MyChart As Chart = New Chart(0, 0, 300, 200)
Dim MyPlotArea = MyChart.PrimaryPlotArea
Dim MyTitle1 As Title = New Title("Top Title")
Dim MyTitle2 As Title = New Title("Bottom Title")
MyChart1.HeaderTitles.Add(title1)
MyChart1.FooterTitles.Add(title2)
Axis Titles
Axis titles describe the data on an x-axis (XAxis) and/or a y-axis (YAxis) represent. Both XAxis and YAxis have a Titles property that is an instance of a TitlesList that contains one or more Title instances.
The following code shows how to add titles to an x-axis and a y-axis.
Chart chart = new Chart(0, 0, 300, 200);
PlotArea plotArea = chart.PrimaryPlotArea;
Title title1 = new Title("XAxis Title");
Title title2 = new Title("YAxis Title");
plotArea.XAxes.DefaultNumericXAxis.Titles.Add(title1);
plotArea.YAxes.DefaultNumericYAxis.Titles.Add(title2);
Dim MyChart As Chart = New Chart(0, 0, 300, 200)
Dim MyPlotArea = MyChart.PrimaryPlotArea
Dim MyTitle1 As Title = New Title("XAxis Title")
Dim MyTitle2 As Title = New Title("YAxis Title")
MyPlotArea.XAxes.DefaultNumericXAxis.Titles.Add(MyTitle1)
MyPlotArea.YAxes.DefaultNumericYAxis.Titles.Add(MyTitle2)