Add Charts to PDFs
Easily add various types of charts to PDF documents, including Area, Bar, Column, Line, Pie, and XYScatter charts using DynamicPDF Core Suite for .NET. The following C# examples illustrate each chart type.
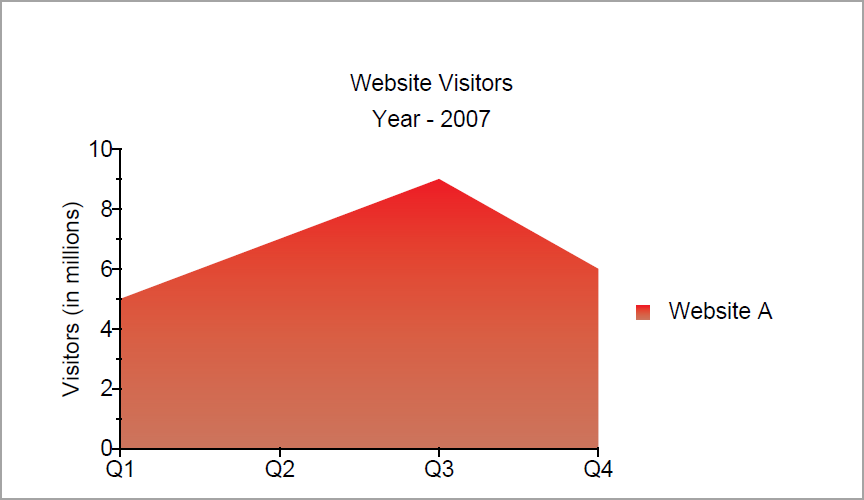
How to Add Area Chart to PDF
The following steps and C# sample code illustrates adding an Area Chart to a PDF document using DynamicPDF Core Suite for .NET.
Steps for Adding an Area Chart to a PDF Document
- Create a
Documentobject. - Create a
Pageobject and add it to theDocumentinstance. - Create a
Chartobject by specifying its parameters in the constructor. - Create a
PlotAreaobject and associate it with theChartinstance. - Create a
Titleobject and associate it with theChartinstance. - Create a
IndexedAreaSeriesobject and values. - Create a
AutoGradientobject and assign it to a series. - Add
IndexedAreaSeriesto thePlotArea. - Add a
Titlefor Y axis. - Add
AxisLablesto X axis. - Add the
Chartinstance to thePageinstance. - Add the
Drawmethod to output the PDF document.
Sample Code - C#
Document document = new Document();
Page page = new Page();
document.Pages.Add(page);
Chart chart = new Chart(0, 0, 400, 230);
PlotArea plotArea = chart.PrimaryPlotArea;
Title title1 = new Title("Website Visitors");
Title title2 = new Title("Year - 2007");
chart.HeaderTitles.Add(title1);
chart.HeaderTitles.Add(title2);
IndexedAreaSeries areaSeries1 = new IndexedAreaSeries("Website A");
areaSeries1.Values.Add(new float[]{5, 7, 9, 6});
AutoGradient autogradient1 = new AutoGradient(90f, CmykColor.Red, CmykColor.IndianRed);
areaSeries1.Color = autogradient1;
plotArea.Series.Add(areaSeries1);
Title lTitle = new Title("Visitors (in millions)");
areaSeries1.YAxis.Titles.Add(lTitle);
areaSeries1.XAxis.Labels.Add(new IndexedXAxisLabel("Q1", 0));
areaSeries1.XAxis.Labels.Add(new IndexedXAxisLabel("Q2", 1));
areaSeries1.XAxis.Labels.Add(new IndexedXAxisLabel("Q3", 2));
areaSeries1.XAxis.Labels.Add(new IndexedXAxisLabel("Q4", 3));
page.Elements.Add(chart);
document.Draw("Output.pdf");
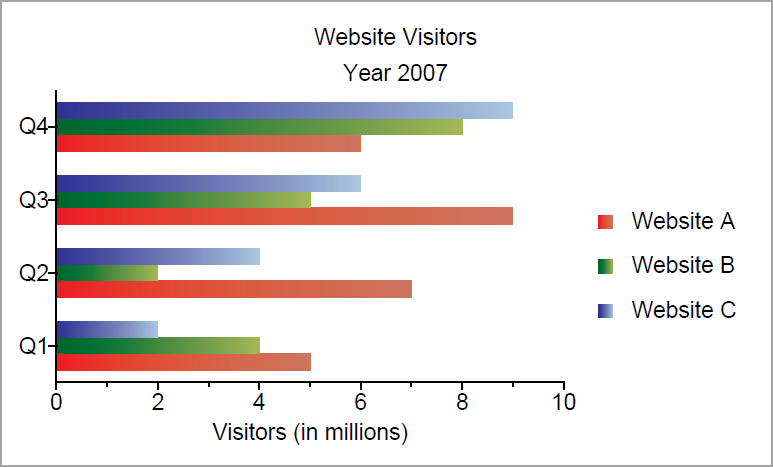
How to Add Bar Chart to PDF
The following steps and C# sample code illustrates adding a Bar Chart to a PDF document using DynamicPDF Core Suite for .NET.
Steps for Adding a Bar Chart to a PDF Document
- Create a
Documentobject. - Create a
Pageobject and add it to theDocumentobject. - Create a
Chartobject by specifying its parameters in the constructor. - Create a
PlotAreaobject and associate it with theChartinstance. - Create a
Titleobject and associate it with theChartinstance. - Create a
IndexedBarSeriesobject and values. - Create a
AutoGradientobject and assign it to a series. - Add an
IndexedBarSeriesto thePlotAreainstance. - Add a
Titlefor X axis. - Add
AxisLablesto Y axis. - Add the
Chartinstance to thePageinstance. - Add the
Drawmethod to output the PDF document.
Sample Code - C#
Document document = new Document();
Page page = new Page();
document.Pages.Add(page);

Chart chart = new Chart(0, 0, 400, 230);
PlotArea plotArea = chart.PrimaryPlotArea;

Title title1 = new Title("Website Visitors");
Title title2 = new Title("Year 2007");
chart.HeaderTitles.Add(title1);
chart.HeaderTitles.Add(title2);

IndexedBarSeries barSeries1 = new IndexedBarSeries("Website A");
barSeries1.Values.Add(new float[] { 5, 7, 9, 6 });
IndexedBarSeries barSeries2 = new IndexedBarSeries("Website B");
barSeries2.Values.Add(new float[] { 4, 2, 5, 8 });
IndexedBarSeries barSeries3 = new IndexedBarSeries("Website C");
barSeries3.Values.Add(new float[] { 2, 4, 6, 9 });

AutoGradient autogradient1 = new AutoGradient(180f, CmykColor.Red, CmykColor.IndianRed);
barSeries1.Color = autogradient1;
AutoGradient autogradient2 = new AutoGradient(180f, CmykColor.Green, CmykColor.YellowGreen);
barSeries2.Color = autogradient2;
AutoGradient autogradient3 = new AutoGradient(180f, CmykColor.Blue, CmykColor.LightBlue);
barSeries3.Color = autogradient3;

plotArea.Series.Add(barSeries1);
plotArea.Series.Add(barSeries2);
plotArea.Series.Add(barSeries3);

Title lTitle = new Title("Visitors (in millions)");
barSeries1.XAxis.Titles.Add(lTitle);

barSeries1.YAxis.Labels.Add(new IndexedYAxisLabel("Q1", 0));
barSeries1.YAxis.Labels.Add(new IndexedYAxisLabel("Q2", 1));
barSeries1.YAxis.Labels.Add(new IndexedYAxisLabel("Q3", 2));
barSeries1.YAxis.Labels.Add(new IndexedYAxisLabel("Q4", 3));

page.Elements.Add(chart);
document.Draw("output.pdf");
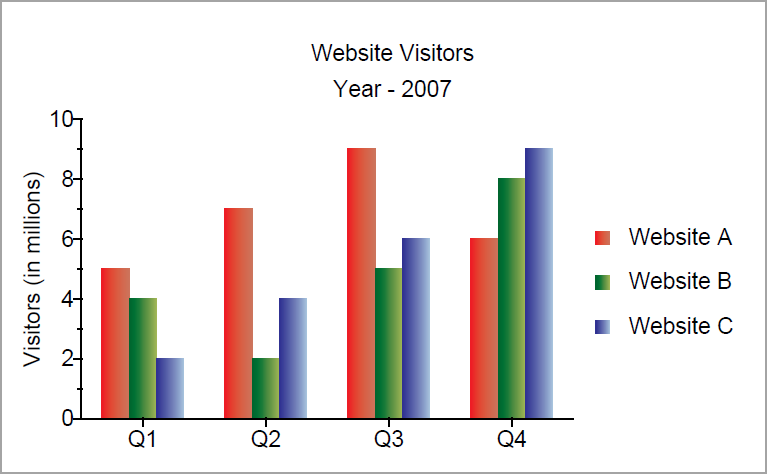
How to Add Column Chart to PDF
The following steps and C# sample code illustrate adding a Column Chart to a PDF document using DynamicPDF Core Suite for .NET.
Steps for Adding Column Chart to a PDF Document
- Create a
Documentobject. - Create a
Pageobject and add it to the Document instance - Create a
Chartobject by specifying its parameters. - Create a
PlotAreaobject and associate it with the Chart object. - Create a
Titleobject and associate it with the Chart instance. - Create a
IndexedColumnSeriesobject and values. - Create a
AutoGradientobject and assign it to a Series. - Add
IndexedColumnSeriesto thePlotArea. - Add a
Titlefor Y axis. - Add
AxisLablesto X axis. - Add the
Chartinstance to thePageinstance. - Add the
Drawmethod to output the PDF document.
Sample Code - C#
Document document = new Document();
Page page = new Page();
document.Pages.Add(page);

Chart chart = new Chart(0, 0, 400, 230);
PlotArea plotArea = chart.PrimaryPlotArea;

Title title1 = new Title("Website Visitors");
Title title2 = new Title("Year - 2007");
chart.HeaderTitles.Add(title1);
chart.HeaderTitles.Add(title2);

IndexedColumnSeries columnSeries1 = new IndexedColumnSeries("Website A");
columnSeries1.Values.Add(new float[] { 5, 7, 9, 6 });
IndexedColumnSeries columnSeries2 = new IndexedColumnSeries("Website B");
columnSeries2.Values.Add(new float[] { 4, 2, 5, 8 });
IndexedColumnSeries columnSeries3 = new IndexedColumnSeries("Website C");
columnSeries3.Values.Add(new float[] { 2, 4, 6, 9 });

AutoGradient autogradient1 = new AutoGradient(180f, CmykColor.Red, CmykColor.IndianRed);
columnSeries1.Color = autogradient1;
AutoGradient autogradient2 = new AutoGradient(180f, CmykColor.Green, CmykColor.YellowGreen);
columnSeries2.Color = autogradient2;
AutoGradient autogradient3 = new AutoGradient(180f, CmykColor.Blue, CmykColor.LightBlue);
columnSeries3.Color = autogradient3;

plotArea.Series.Add(columnSeries1);
plotArea.Series.Add(columnSeries2);
plotArea.Series.Add(columnSeries3);

Title lTitle = new Title("Visitors (in millions)");
columnSeries1.YAxis.Titles.Add(lTitle);

columnSeries1.XAxis.Labels.Add(new IndexedXAxisLabel("Q1", 0));
columnSeries1.XAxis.Labels.Add(new IndexedXAxisLabel("Q2", 1));
columnSeries1.XAxis.Labels.Add(new IndexedXAxisLabel("Q3", 2));
columnSeries1.XAxis.Labels.Add(new IndexedXAxisLabel("Q4", 3));

page.Elements.Add(chart);
document.Draw("output.pdf");
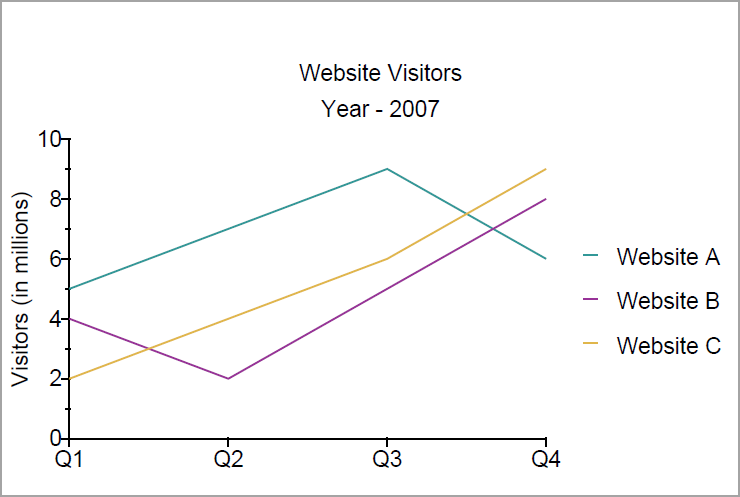
How to Add Line Chart to PDF
The following steps and C# sample code add a Line Chart to PDF document using DynamicPDF Core Suite.
Steps for Adding a Line Chart to a PDF Document
- Create a
Documentobject. - Create a
Pageobject and add it to theDocumentinstance. - Create a
Chartobject by specifying its parameters. - Create a
PlotAreaobject and associate with theChartinstance. - Create a
Titleobject and associate with theChartinstance. - Create a
IndexedLineSeriesobject and values. - Create a
AutoGradientobject and assign it to a series. - Add an
IndexedLineSeriesto thePlotArea. - Add
Titlefor Y axis. - Add
AxisLablesto X axis. - Add the
Chartinstance to thePageinstance. - Add the
Drawmethod to output the PDF document.
Sample Code - C#
// Create a PDF Document
Document document = new Document();
// Create a Page and add it to the document
Page page = new Page();
document.Pages.Add(page);

// Create a chart
Chart chart = new Chart(0, 0, 400, 230);
// Create a plot area
PlotArea plotArea = chart.PrimaryPlotArea;

// Create header titles and add it to the chart
Title title1 = new Title("Website Visitors");
Title title2 = new Title("Year - 2007");
chart.HeaderTitles.Add(title1);
chart.HeaderTitles.Add(title2);

// Create a indexed line series and add values to it
IndexedLineSeries lineSeries1 = new IndexedLineSeries("Website A");
lineSeries1.Values.Add(new float[] { 5, 7, 9, 6 });
IndexedLineSeries lineSeries2 = new IndexedLineSeries("Website B");
lineSeries2.Values.Add(new float[] { 4, 2, 5, 8 });
IndexedLineSeries lineSeries3 = new IndexedLineSeries("Website C");
lineSeries3.Values.Add(new float[] { 2, 4, 6, 9 });

// Add indexed line series to the plot area
plotArea.Series.Add(lineSeries1);
plotArea.Series.Add(lineSeries2);
plotArea.Series.Add(lineSeries3);

// Create a title and add it to the yaxis
Title lTitle = new Title("Visitors (in millions)");
lineSeries1.YAxis.Titles.Add(lTitle);

//Adding AxisLabels to the XAxis
lineSeries1.XAxis.Labels.Add(new IndexedXAxisLabel("Q1", 0));
lineSeries1.XAxis.Labels.Add(new IndexedXAxisLabel("Q2", 1));
lineSeries1.XAxis.Labels.Add(new IndexedXAxisLabel("Q3", 2));
lineSeries1.XAxis.Labels.Add(new IndexedXAxisLabel("Q4", 3));

// Add the chart to the page
page.Elements.Add(chart);
// Save the PDF
document.Draw("output.pdf");
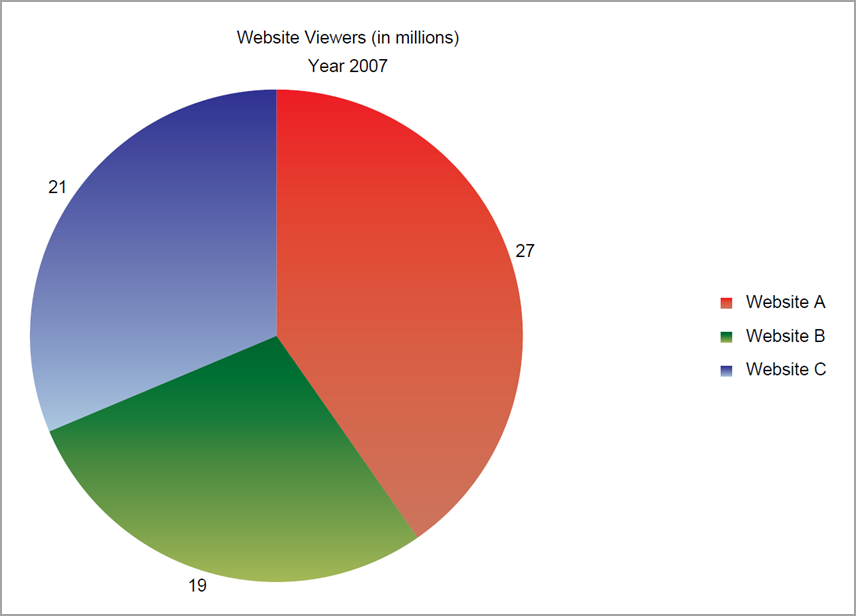
How to Add Pie Chart to PDF
The following steps and C# sample code illustrate adding a Pie Chart to a PDF document using DynamicPDF Core Suite.
Steps for Adding a Pie Chart to a PDF Document
- Create a
Documentobject. - Create a
Pageobject and add it to theDocumentinstance. - Create a
Chartobject by specifying its parameters. - Create a
PlotAreaobject and associate it with theChartobject instance. - Create a
Titleobject and associate it with theChartobject instance. - Create a
AutoGradientobject and assign it to a series. - Create a
ScalarDataLabelobject. - Create a
PieSeriesobject and assign the data label, values and color. - Add the
Chartinstance to thePageinstance. - Add the
Drawmethod to output the PDF document.
Sample Code - C#
Document document = new Document();
Page page = new Page(PageSize.A4, PageOrientation.Landscape);
document.Pages.Add(page);

Chart chart = new Chart(0, 0, 700, 400);
PlotArea plotArea = chart.PlotAreas.Add(50, 50, 300, 300);

Title tTitle = new Title("Website Viewers (in millions)");
Title tTitle1 = new Title("Year 2007");
chart.HeaderTitles.Add(tTitle);
chart.HeaderTitles.Add(tTitle1);

AutoGradient autogradient1 = new AutoGradient(90f, CmykColor.Red, CmykColor.IndianRed);
AutoGradient autogradient2 = new AutoGradient(90f, CmykColor.Green, CmykColor.YellowGreen);
AutoGradient autogradient3 = new AutoGradient(90f, CmykColor.Blue, CmykColor.LightBlue);

ScalarDataLabel da = new ScalarDataLabel(true, false, false);
PieSeries pieSeries = new PieSeries();
pieSeries.DataLabel = da;
plotArea.Series.Add(pieSeries);

pieSeries.Elements.Add(27, "Website A");
pieSeries.Elements.Add(19, "Website B");
pieSeries.Elements.Add(21, "Website C");

pieSeries.Elements[0].Color = autogradient1;
pieSeries.Elements[1].Color = autogradient2;
pieSeries.Elements[2].Color = autogradient3;

page.Elements.Add(chart);
document.Draw(@"Output.pdf");
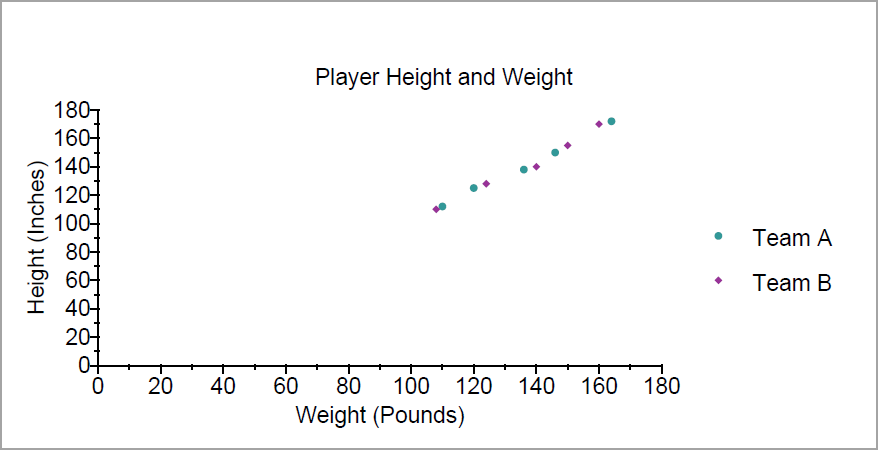
How to Add XYScatter Chart to PDF
The following steps and C# sample code illustrate adding an XYScatter Chart to a PDF document.
Steps for Adding an XYScatter Chart to a PDF Document
- Create a
Documentobject. - Create a
Pageobject and add it to theDocumentinstance. - Create a
Chartobject by specifying its parameters. - Create a
PlotAreaobject and associate it with theChartobject instance. - Create a
Titleobject and associate it with theChartinstance. - Create a
XYScatterSeriesobject and assign its values. - Add the series to
PlotArea. - Add
Titleto the X and Y axis. - Add the
Chartinstance to thePageinstance. - Add the
Drawmethod to output the PDF document.
Sample Code - C#
Document document = new Document();
Page page = new Page();
document.Pages.Add(page);

Chart chart = new Chart(0, 0, 450, 200);
PlotArea plotArea = chart.PrimaryPlotArea;

Title tTitle = new Title("Player Height and Weight");
chart.HeaderTitles.Add(tTitle);

XYScatterSeries xyScatterSeries1 = new XYScatterSeries("Team A");
xyScatterSeries1.Values.Add(112, 110);
xyScatterSeries1.Values.Add(125, 120);
xyScatterSeries1.Values.Add(138, 136);
xyScatterSeries1.Values.Add(150, 146);
xyScatterSeries1.Values.Add(172, 164);
XYScatterSeries xyScatterSeries2 = new XYScatterSeries("Team B");
xyScatterSeries2.Values.Add(110, 108);
xyScatterSeries2.Values.Add(128, 124);
xyScatterSeries2.Values.Add(140, 140);
xyScatterSeries2.Values.Add(155, 150);
xyScatterSeries2.Values.Add(170, 160);

plotArea.Series.Add(xyScatterSeries1);
plotArea.Series.Add(xyScatterSeries2);

Title title1 = new Title("Height (Inches)");
Title title2 = new Title("Weight (Pounds)");
xyScatterSeries1.YAxis.Titles.Add(title1);
xyScatterSeries1.XAxis.Titles.Add(title2);

page.Elements.Add(chart);
document.Draw(@"Output.pdf");
GitHub Project
An example project is available on GitHub (examples.dynamicpdf-core-suite-dotnet-core). Examples are provided in C# and VB.NET. Clone or view the example project at GitHub. This specific example discussed on this page are all contained in following classes on GitHub
- C# - ChartsExample.cs
- VB.NET - ChartsExample.vb
Getting Started
Get started easily by installing DynamicPDF Core Suite for .NET through NuGet or manually. Then, refer to the documentation for more information on using and purchasing the product.
NuGet Package
The easiest way to install DynamicPDF Core Suite is by obtaining the NuGet package using Visual Studio's Package Manager. You can also obtain the NuGet package by downloading it directly. Refer to the installation documentation for more information.
DynamicPDF Core Suite Information
DynamicPDF Core Suite for .NET combines creating, merging, and visual report creation into one powerful product for creating PDF documents. It is ideal for anyone who needs to generate PDF documents or reports or work with existing PDFs in their applications. With a free Evaluation Edition to try and with flexible and royalty-free licensing options, why not start using DynamicPDF Core Suite for .NET today!
More Information on Charts
- Refer to the Charts documentation topic, or
- Chapter 10 and Chapter 11, Charts I and Charts II, in the book DynamicPDF Core Suite for .NET by Example available on GitHub.
Available on Other Platforms
DynamicPDF Core Suite is also available for the Java and COM/ActiveX platforms. Refer to the respective product pages for more details.
- DynamicPDF Generator
- Java - DynamicPDF Generator for Java
- COM/ActiveX - DynamicPDF Generator for COM/ActiveX
- DynamicPDF Merger
- Java - DynamicPDF Merger for Java
- COM/ActiveX - DynamicPDF Merger for COM/ActiveX